
M1 January 2010 Q2
2. An athlete runs along a straight road. She starts from rest and moves with constant acceleration for 5 seconds, reaching a speed of 8 m s\(^{-1}\). This speed is then maintained for \(T\) seconds. She then decelerates at a constant rate until she stops. She has run a total of 500 m in 75 s.
(a) In the space below, sketch a speed-time graph to illustrate the motion of the athlete. (3)
(b) Calculate the value of \(T\). (5)
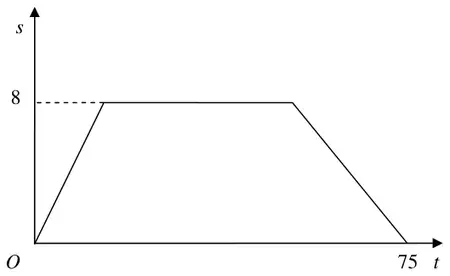
| Scheme | Marks |
|---|---|
| First two line segments | B1 |
| Third line segment | B1 |
| 8, 75 | B1 |
| (3) |
| Scheme | Marks |
|---|---|
| \(\tfrac{1}{2} \times 8 \times (T + 75) = 500\) | M1 A2 (1,0) |
| Solving to \(T = 50\) | DM1 A1 |
| (5) | |
| (8 marks) |