
C4 June 2017 Q3
3.
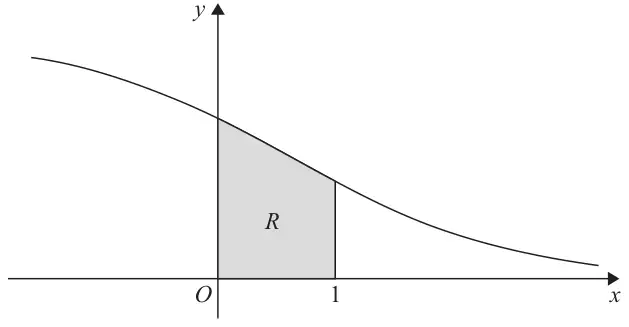
Figure 1 shows a sketch of part of the curve with equation \(y = \dfrac{6}{(\mathrm{e}^x + 2)},\ x \in \mathbb{R}\)
The finite region \(R\), shown shaded in Figure 1, is bounded by the curve, the \(y\)-axis, the \(x\)-axis and the line with equation \(x = 1\)
The table below shows corresponding values of \(x\) and \(y\) for \(y = \dfrac{6}{(\mathrm{e}^x + 2)}\)
| \(x\) | 0 | 0.2 | 0.4 | 0.6 | 0.8 | 1 |
|---|---|---|---|---|---|---|
| \(y\) | 2 | 1.71830 | 1.56981 | 1.41994 | 1.27165 |
[Solutions based entirely on graphical or numerical methods are not acceptable.] (6)
| Scheme | Marks | ||||||||||||||
|---|---|---|---|---|---|---|---|---|---|---|---|---|---|---|---|
| |||||||||||||||
| \(\{\text{At } x = 0.2,\}\ y = 1.86254\) (5 dp) 1.86254 | B1 cao | ||||||||||||||
| Note: Look for this value on the given table or in their working. | |||||||||||||||
| (1) |
| Scheme | Marks |
|---|---|
| \(\dfrac{1}{2}(0.2)\Big[\underline{2 + 1.27165 + 2\big(\text{their } 1.86254 + 1.71830 + 1.56981 + 1.41994\big)}\Big]\) Outside brackets \(\dfrac{1}{2} \times (0.2)\) or \(\dfrac{1}{10}\) or \(\dfrac{1}{2} \times \dfrac{1}{5}\) For structure of \(\big[\ldots\ldots\big]\) | B1 o.e. M1 |
| \(\left\{= \dfrac{1}{10}(16.41283)\right\} = 1.641283 = 1.6413\) (4 dp) anything that rounds to 1.6413 | A1 |
| (3) |
Notes
Note: M1: Do not allow an extra \(y\)-value or a repeated \(y\) value in their […]
Do not allow an omission of a \(y\)-ordinate in their […] for M1 unless they give the correct answer of awrt 1.6413, in which case both M1 and A1 can be scored.
Note: A1: Working must be seen to demonstrate the use of the trapezium rule. (Actual area is 1.64150274…)
Note: Full marks can be gained in part (b) for awrt 1.6413 even if B0 is given in part (a)
Note: Award B1M1A1 for \(\dfrac{1}{10}(2 + 1.27165) + \dfrac{1}{5}(\text{their } 1.86254 + 1.71830 + 1.56981 + 1.41994)\) = awrt 1.6413
Bracketing mistakes: Unless the final answer implies that the calculation has been done correctly
Award B1M0A0 for \(\dfrac{1}{2}(0.2) + 2 + 2(\text{their } 1.86254 + 1.71830 + 1.56981 + 1.41994) + 1.27165\) (=16.51283)
Award B1M0A0 for \(\dfrac{1}{2}(0.2)(2 + 1.27165) + 2(\text{their } 1.86254 + 1.71830 + 1.56981 + 1.41994)\) (=13.468345)
Award B1M0A0 for \(\dfrac{1}{2}(0.2)(2) + 2(\text{their } 1.86254 + 1.71830 + 1.56981 + 1.41994) + 1.27165\) (=14.61283)
Alternative method: Adding individual trapezia
Area \(\approx 0.2 \times \left[\dfrac{2 + \text{"}1.86254\text{"}}{2} + \dfrac{\text{"}1.86254\text{"} + 1.71830}{2} + \dfrac{1.71830 + 1.56981}{2} + \dfrac{1.56981 + 1.41994}{2} + \dfrac{1.41994 + 1.27165}{2}\right]\)
\(= 1.641283\)
B1: 0.2 and a divisor of 2 on all terms inside brackets
M1: First and last ordinates once and two of the middle ordinates inside brackets ignoring the 2
A1: anything that rounds to 1.6413
| Scheme | Marks |
|---|---|
| \(\{u = \mathrm{e}^x \text{ or } x = \ln u \Rightarrow\}\) | |
| \(\dfrac{\mathrm{d}u}{\mathrm{d}x} = \mathrm{e}^x\) or \(\dfrac{\mathrm{d}u}{\mathrm{d}x} = u\) or \(\dfrac{\mathrm{d}x}{\mathrm{d}u} = \dfrac{1}{u}\) or \(\mathrm{d}u = u\,\mathrm{d}x\) etc., and \(\displaystyle\int \dfrac{6}{(\mathrm{e}^x + 2)}\,\mathrm{d}x = \displaystyle\int \dfrac{6}{(u + 2)u}\,\mathrm{d}u\) See notes | B1 * |
| \(\{x = 0\} \Rightarrow a = \mathrm{e}^0 \Rightarrow \underline{a = 1}\) \(\{x = 1\} \Rightarrow b = \mathrm{e}^1 \Rightarrow \underline{b = \mathrm{e}}\) \(a = 1\) and \(b = \mathrm{e}\) or \(b = \mathrm{e}^1\) or evidence of \(0 \to 1\) and \(1 \to \mathrm{e}\) | B1 |
| NOTE: 1st B1 mark CANNOT be recovered for work in part (d) NOTE: 2nd B1 mark CAN be recovered for work in part (d) | |
| (2) |
Notes
1st B1: Must start from either
- \(\displaystyle\int y\,\mathrm{d}x\), with integral sign and \(\mathrm{d}x\)
- \(\displaystyle\int \dfrac{6}{(\mathrm{e}^x + 2)}\,\mathrm{d}x\), with integral sign and \(\mathrm{d}x\)
- \(\displaystyle\int \dfrac{6}{(\mathrm{e}^x + 2)}\dfrac{\mathrm{d}x}{\mathrm{d}u}\,\mathrm{d}u\), with integral sign and \(\dfrac{\mathrm{d}x}{\mathrm{d}u}\mathrm{d}u\)
and state either \(\dfrac{\mathrm{d}u}{\mathrm{d}x} = \mathrm{e}^x\) or \(\dfrac{\mathrm{d}u}{\mathrm{d}x} = u\) or \(\dfrac{\mathrm{d}x}{\mathrm{d}u} = \dfrac{1}{u}\) or \(\mathrm{d}u = u\,\mathrm{d}x\)
and end at \(\displaystyle\int \dfrac{6}{u(u + 2)}\,\mathrm{d}u\), with integral sign and \(\mathrm{d}u\), with no incorrect working.
Note: So, just writing \(\dfrac{\mathrm{d}u}{\mathrm{d}x} = \mathrm{e}^x\) and \(\displaystyle\int \dfrac{6}{(\mathrm{e}^x + 2)}\,\mathrm{d}x = \displaystyle\int \dfrac{6}{u(u + 2)}\,\mathrm{d}u\) is sufficient for 1st B1
Note: Give 2nd B0 for \(b = 2.718\ldots\), without reference to \(a = 1\) and \(b = \mathrm{e}\) or \(b = \mathrm{e}^1\)
Note: You can also give the 1st B1 mark for using a reverse process. i.e.
Proceeding from \(\displaystyle\int \dfrac{6}{u(u + 2)}\,\mathrm{d}u\) to \(\displaystyle\int \dfrac{6}{(\mathrm{e}^x + 2)}\,\mathrm{d}x\), with no incorrect working,
and stating either \(\dfrac{\mathrm{d}u}{\mathrm{d}x} = \mathrm{e}^x\) or \(\dfrac{\mathrm{d}u}{\mathrm{d}x} = u\) or \(\dfrac{\mathrm{d}x}{\mathrm{d}u} = \dfrac{1}{u}\) or \(\mathrm{d}u = u\,\mathrm{d}x\)
| Scheme | Marks |
|---|---|
| Way 1 | |
| \(\dfrac{6}{u(u + 2)} \equiv \dfrac{A}{u} + \dfrac{B}{(u + 2)}\) \(\Rightarrow 6 \equiv A(u + 2) + Bu\) Writing \(\dfrac{6}{u(u + 2)} \equiv \dfrac{A}{u} + \dfrac{B}{(u + 2)}\), o.e. or \(\dfrac{1}{u(u + 2)} \equiv \dfrac{P}{u} + \dfrac{Q}{(u + 2)}\), o.e., and a complete method for finding the value of at least one of their \(A\) or their \(B\) (or their \(P\) or their \(Q\)) | M1 |
| \(u = 0 \Rightarrow A = 3\) \(u = -2 \Rightarrow B = -3\) Both their \(A = 3\) and their \(B = -3\). (Or their \(P = \tfrac{1}{2}\) and their \(Q = -\tfrac{1}{2}\) with the factor of 6 in front of the integral sign) | A1 |
| \(\displaystyle\int \dfrac{6}{u(u + 2)}\,\mathrm{d}u = \displaystyle\int \left(\dfrac{3}{u} - \dfrac{3}{(u + 2)}\right)\mathrm{d}u\) \(= 3\ln u - 3\ln(u + 2)\) or \(= 3\ln 2u - 3\ln(2u + 4)\) Integrates \(\dfrac{M}{u} \pm \dfrac{N}{u \pm k}\), \(M, N, k \neq 0\); (i.e. a two term partial fraction) to obtain either \(\pm\lambda\ln(\alpha u)\) or \(\pm\mu\ln(\beta(u \pm k))\); \(\lambda, \mu, \alpha, \beta \neq 0\) Integration of both terms is correctly followed through from their \(M\) and from their \(N\). | M1 A1 ft |
| \(\left\{\text{So } \big[3\ln u - 3\ln(u + 2)\big]_1^{\mathrm{e}}\right\}\) \(= \big(3\ln(\mathrm{e}) - 3\ln(\mathrm{e} + 2)\big) - \big(3\ln 1 - 3\ln 3\big)\) [Note: A proper consideration of the limit of \(u = 1\) is required for this mark] dependent on the 2nd M mark Applies limits of e and 1 (or their \(b\) and their \(a\), where \(b > 0, b \neq 1, a > 0\)) in \(u\) or applies limits of 1 and 0 in \(x\) and subtracts the correct way round. | dM1 |
| \(= 3 - 3\ln(\mathrm{e} + 2) + 3\ln 3\) or \(3(1 - \ln(\mathrm{e} + 2) + \ln 3)\) or \(3 + 3\ln\left(\dfrac{3}{\mathrm{e} + 2}\right)\) or \(3\ln\left(\dfrac{\mathrm{e}}{\mathrm{e} + 2}\right) - 3\ln\left(\dfrac{1}{3}\right)\) or \(3 - 3\ln\left(\dfrac{\mathrm{e} + 2}{3}\right)\) or \(3\ln\left(\dfrac{3\mathrm{e}}{\mathrm{e} + 2}\right)\) or \(\ln\left(\dfrac{27\mathrm{e}^3}{(\mathrm{e} + 2)^3}\right)\) see notes | A1 cso |
| Note: Allow \(\mathrm{e}^1\) in place of e for the final A1 mark. | |
| (6) | |
| (12 marks) |
Notes
Note: Give final A0 for \(3 - 3\ln\mathrm{e} + 2 + 3\ln 3\) (i.e. bracketing error) unless recovered.
Note: Give final A0 for \(3 - 3\ln(\mathrm{e} + 2) + 3\ln 3 - 3\ln 1\), where \(3\ln 1\) has not been simplified to 0
Note: Give final A0 for \(3\ln\mathrm{e} - 3\ln(\mathrm{e} + 2) + 3\ln 3\), where \(3\ln\mathrm{e}\) has not been simplified to 3
Note: Give final A0 for \(3 - 3\ln(\mathrm{e} + 2) + 3\ln 3\) simplifying to \(1 - \ln(\mathrm{e} + 2) + \ln 3\) (i.e. dividing their correct final answer by 3)
Otherwise, you can ignore incorrect working (isw) following on from a correct exact value.
Note: A decimal answer of 1.641502724… (without a correct exact answer) is final A0
Note: \(\big[-3\ln(u + 2) + 3\ln u\big]_1^{\mathrm{e}}\) followed by awrt 1.64 (without a correct exact answer) is final M1A0
Note: BE CAREFUL! Candidates will assign their own “\(A\)” and “\(B\)” for this question.
Note: Writing down \(\dfrac{6}{(u + 2)u}\) in the form \(\dfrac{A}{(u + 2)} + \dfrac{B}{u}\) with at least one of \(A\) or \(B\) correct is 1st M1
Note: Writing down \(\dfrac{6}{(u + 2)u}\) as \(\dfrac{-3}{(u + 2)} + \dfrac{3}{u}\) is 1st M1 1st A1.
Note: Condone \(\displaystyle\int \left(\dfrac{3}{u} - \dfrac{3}{(u + 2)}\right)\mathrm{d}u\) to give \(3\ln u - 3\ln u + 2\) (poor bracketing) for 2nd A1.
Note: Award M0A0M1A1ft for a candidate who writes down
e.g. \(\displaystyle\int \dfrac{6}{u(u + 2)}\,\mathrm{d}u = \displaystyle\int \left(\dfrac{6}{u} + \dfrac{6}{(u + 2)}\right)\mathrm{d}u = 6\ln u + 6\ln(u + 2)\)
AS EVIDENCE OF WRITING \(\dfrac{6}{u(u + 2)}\) AS PARTIAL FRACTIONS.
Note: Award M0A0M0A0 for a candidate who writes down
\(\displaystyle\int \dfrac{6}{u(u + 2)}\,\mathrm{d}u = 6\ln u + 6\ln(u + 2)\) or \(\displaystyle\int \dfrac{6}{u(u + 2)}\,\mathrm{d}u = \ln u + 6\ln(u + 2)\)
WITHOUT ANY EVIDENCE OF WRITING \(\dfrac{6}{u(u + 2)}\) as partial fractions.
Note: Award M1A1M1A1 for a candidate who writes down
\(\displaystyle\int \dfrac{6}{u(u + 2)}\,\mathrm{d}u = 3\ln u - 3\ln(u + 2)\)
WITHOUT ANY EVIDENCE OF WRITING \(\dfrac{6}{u(u + 2)}\) as partial fractions.
Note: If they lose the “6” and find \(\displaystyle\int_1^{\mathrm{e}} \dfrac{1}{u(u + 2)}\,\mathrm{d}u\) we can allow a maximum of M1A0M1A1ftM1A0
Way 2
| Scheme | Marks |
|---|---|
| \(\left\{\displaystyle\int \dfrac{6}{u^2 + 2u}\,\mathrm{d}u = \displaystyle\int \dfrac{3(2u + 2)}{u^2 + 2u}\,\mathrm{d}u - \displaystyle\int \dfrac{6u}{u^2 + 2u}\,\mathrm{d}u\right\}\) | |
| \(= \displaystyle\int \dfrac{3(2u + 2)}{u^2 + 2u}\,\mathrm{d}u - \displaystyle\int \dfrac{6}{u + 2}\,\mathrm{d}u\) \(\displaystyle\int \dfrac{\pm\alpha(2u + 2)}{u^2 + 2u}\{\mathrm{d}u\} \pm \displaystyle\int \dfrac{\delta}{u + 2}\{\mathrm{d}u\},\ \alpha, \beta, \delta \neq 0\) Correct expression | M1 A1 |
| \(= 3\ln(u^2 + 2u) - 6\ln(u + 2)\) Integrates \(\dfrac{\pm M(2u + 2)}{u^2 + 2u} \pm \dfrac{N}{u \pm k}\), \(M, N, k \neq 0\), to obtain any one of \(\pm\lambda\ln(u^2 + 2u)\) or \(\pm\mu\ln(\beta(u \pm k))\); \(\lambda, \mu, \beta \neq 0\) Integration of both terms is correctly followed through from their \(M\) and from their \(N\) | M1 A1 ft |
| \(\left\{\text{So, } \big[3\ln(u^2 + 2u) - 6\ln(u + 2)\big]_1^{\mathrm{e}}\right\}\) \(= \big(3\ln(\mathrm{e}^2 + 2\mathrm{e}) - 6\ln(\mathrm{e} + 2)\big) - \big(3\ln 3 - 6\ln 3\big)\) dependent on the 2nd M mark Applies limits of e and 1 (or their \(b\) and their \(a\), where \(b > 0, b \neq 1, a > 0\)) in \(u\) or applies limits of 1 and 0 in \(x\) and subtracts the correct way round. | dM1 |
| \(= 3\ln(\mathrm{e}^2 + 2\mathrm{e}) - 6\ln(\mathrm{e} + 2) + 3\ln 3\) \(3\ln(\mathrm{e}^2 + 2\mathrm{e}) - 6\ln(\mathrm{e} + 2) + 3\ln 3\) | A1 o.e. |
| (6) |
Way 3
| Scheme | Marks |
|---|---|
| Applying \(u = \theta - 1\) | |
| \(\left\{\displaystyle\int_1^{\mathrm{e}} \dfrac{6}{u(u + 2)}\,\mathrm{d}u =\right\} \displaystyle\int_2^{1 + \mathrm{e}} \dfrac{6}{(\theta - 1)(\theta + 1)}\,\mathrm{d}\theta = \displaystyle\int_2^{1 + \mathrm{e}} \dfrac{6}{\theta^2 - 1}\,\mathrm{d}u = \left[3\ln\left(\dfrac{\theta - 1}{\theta + 1}\right)\right]_2^{1 + \mathrm{e}}\) | M1A1M1A1 |
| \(= 3\ln\left(\dfrac{1 + \mathrm{e} - 1}{\mathrm{e} + 1 + 1}\right) - 3\ln\left(\dfrac{2 - 1}{2 + 1}\right) = 3\ln\left(\dfrac{\mathrm{e}}{\mathrm{e} + 2}\right) - 3\ln\left(\dfrac{1}{3}\right)\) 3rd M mark is dependent on 2nd M mark | dM1A1 |
| (6) |