
S1 January 2005 Q3
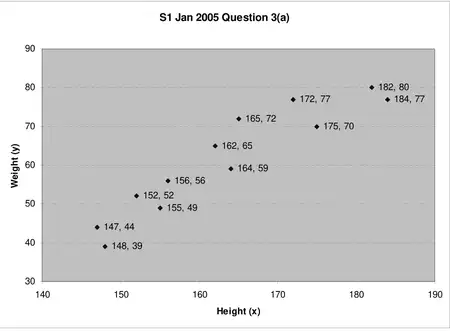
3. The following table shows the height \(x\), to the nearest cm, and the weight \(y\), to the nearest kg, of a random sample of 12 students.
| \(x\) | 148 | 164 | 156 | 172 | 147 | 184 | 162 | 155 | 182 | 165 | 175 | 152 |
|---|---|---|---|---|---|---|---|---|---|---|---|---|
| \(y\) | 39 | 59 | 56 | 77 | 44 | 77 | 65 | 49 | 80 | 72 | 70 | 52 |
(a) On graph paper, draw a scatter diagram to represent these data. (3)
(b) Write down, with a reason, whether the correlation coefficient between \(x\) and \(y\) is positive or negative. (2)
The data in the table can be summarised as follows.
\[\Sigma x = 1962, \quad \Sigma y = 740, \quad \Sigma y^2 = 47\,746, \quad \Sigma xy = 122\,783, \quad S_{xx} = 1745.\](c) Find \(S_{xy}\). (2)
The equation of the regression line of \(y\) on \(x\) is \(y = -106.331 + bx\).
(d) Find, to 3 decimal places, the value of \(b\). (2)
(e) Find, to 3 significant figures, the mean \(\bar{y}\) and the standard deviation \(s\) of the weights of this sample of students. (3)
(f) Find the values of \(\bar{y} \pm 1.96s\). (2)
(g) Comment on whether or not you think that the weights of these students could be modelled by a normal distribution. (1)
| Scheme | Marks |
|---|---|
| Scales and labels | B1 |
| 10 or 11 points correct, all correct | B1,B1 |
| (3) |
| Scheme | Marks |
|---|---|
| Positive; as \(x\) increases, \(y\) increases | B1;B1 |
| (2) |
| Scheme | Marks |
|---|---|
| \(S_{xy} = 122783 - \dfrac{1962 \times 740}{12} = 1793\) | M1A1 |
| (2) |
Notes
M1A1 use of formula, cao
| Scheme | Marks |
|---|---|
| \(b = \dfrac{S_{xy}}{S_{xx}} = \dfrac{1793}{1745} = 1.027507\ldots\) | M1A1 |
| (2) |
Notes
M1A1 division, 1.028
| Scheme | Marks |
|---|---|
| \(\bar{y} = \dfrac{740}{12} = 61\tfrac{2}{3}\) | B1 |
| \(s = \sqrt{\dfrac{47746}{12} - \left(\dfrac{740}{12}\right)^2} = 13.26859\ldots\) | M1A1 |
| (3) |
Notes
B1 \(61\tfrac{2}{3}\) or \(61.\dot{6}\) or 61.7
M1A1 use of formula including root, 13.3
| Scheme | Marks |
|---|---|
| 35.7, 87.7 | B1B1 |
| (2) |
| Scheme | Marks |
|---|---|
| All values between 35.7 and 87.7 so could be normal. | B1 |
| (1) | |
| (15 marks) |
Notes
B1 Reason required