
S1 June 2005 Q1
1. The scatter diagrams below were drawn by a student.
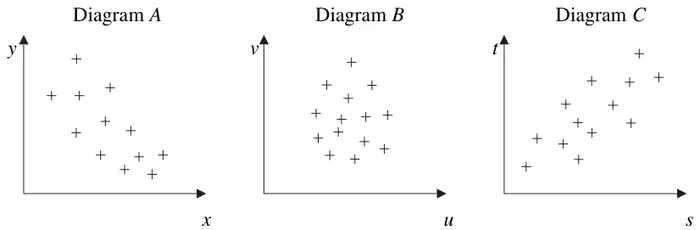
The student calculated the value of the product moment correlation coefficient for each of the sets of data.
The values were
\[0.68 \qquad -0.79 \qquad 0.08\]Write down, with a reason, which value corresponds to which scatter diagram. (6)
| Scheme | Marks |
|---|---|
| Diagram \(A\) : \(y\) & \(x\) : \(r = -0.79\); As \(x\) increases, \(y\) decreases or most points lie in the 2nd and 4th quadrant. | B1;B1dep |
| Diagram \(B\) : \(v\) & \(u\) : \(r = 0.08\); No real pattern. Several values of \(v\) for one value of \(u\) or points lie in all four quadrants, randomly scattered. | B1;B1dep |
| Diagram \(C\) : \(t\) & \(s\) : \(r = 0.68\); As \(s\) increases, \(t\) increases or most points lie in the 1st and 3rd quadrants | B1;B1dep |
| (6) | |
| (6 marks) |