
C3 January 2013 Q3
3.
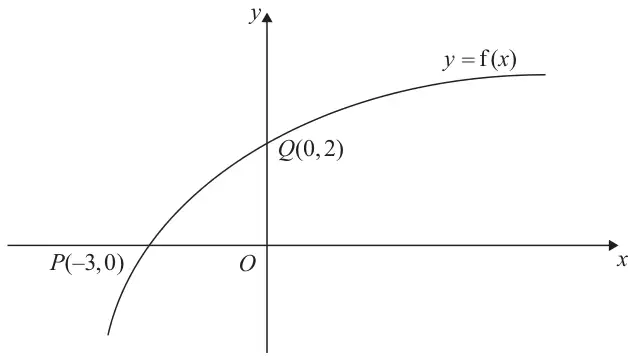
Figure 1 shows part of the curve with equation \(y = \mathrm{f}(x),\ x \in \mathbb{R}\).
The curve passes through the points \(Q(0, 2)\) and \(P(-3, 0)\) as shown.
On separate diagrams, sketch the curve with equation
Indicate clearly on each sketch the coordinates of the points at which the curve crosses or meets the axes.
| Scheme | Marks |
|---|---|
| ff(-3)= f(0),=2 | M1,A1 |
| (2) |
Notes
M1 A full method of finding ff(-3). f(0) is acceptable but f(-3)=0 is not.
Accept a solution obtained from two substitutions into the equation \(y = \dfrac{2}{3}x + 2\) as the line passes through both points. Do not allow for \(y = \ln(x + 4)\), which only passes through one of the points.
A1 Cao ff(-3)=2. Writing down 2 on its own is enough for both marks provided no incorrect working is seen.
| Scheme | Marks |
|---|---|
| Shape | B1 |
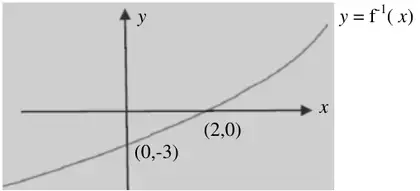
| (0,-3) and (2,0) | B1 |
| (2) |
Notes
B1 For the correct shape. Award this mark for an increasing function in quadrants 3, 4 and 1 only.
Do not award if the curve bends back on itself or has a clear minimum
B1 This is independent to the first mark and for the graph passing through (0,-3) and (2, 0)
Accept -3 and 2 marked on the correct axes.
Accept (-3,0) and (0,2) instead of (0,-3) and (2,0) as long as they are on the correct axes
Accept P’=(0,-3), Q’=(2,0) stated elsewhere as long as P’and Q’ are marked in the correct place on the graph
There must be a graph for this to be awarded
| Scheme | Marks |
|---|---|
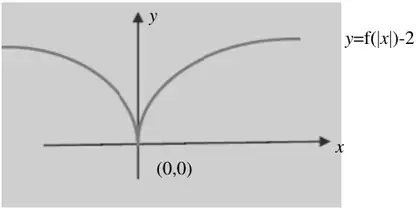
| Shape | B1 |
| (0,0) | B1 |
| (2) |
Notes
B1 Award for a correct shape ‘roughly’ symmetrical about the y- axis. It must have a cusp and a gradient that ‘decreases’ either side of the cusp. Do not award if the graph has a clear maximum
B1 (0,0) lies on their graph. Accept the graph passing through the origin without seeing (0, 0) marked
| Scheme | Marks |
|---|---|
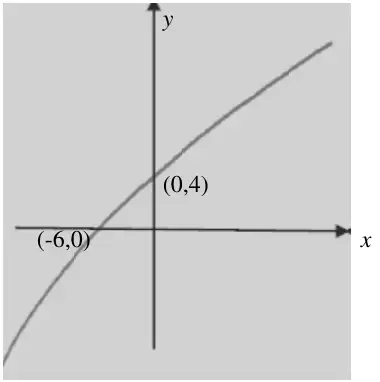
| Shape | B1 |
| (-6,0) or (0,4) | B1 |
| (-6,0) and (0,4) | B1 |
| (3) | |
| (9 marks) |
Notes
B1 Shape. The position is not important. The gradient should be always positive but decreasing There should not be a clear maximum point.
B1 The graph passes through (0,4) or (-6,0). See part (b) for allowed variations
B1 The graph passes through (0,4) and (-6,0). See part (b) for allowed variations