
C3 June 2011 Q3
3.
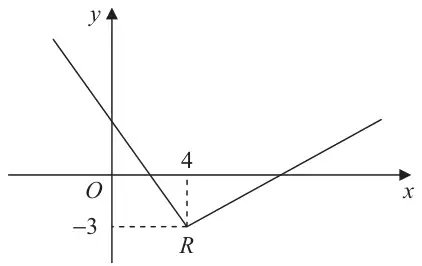
Figure 1 shows part of the graph of \(y = \mathrm{f}(x),\ x \in \mathbb{R}\).
The graph consists of two line segments that meet at the point \(R(4, -3)\), as shown in Figure 1.
Sketch, on separate diagrams, the graphs of
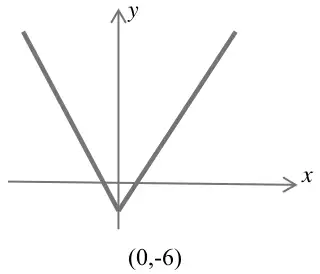
(a) \(y = 2\mathrm{f}(x + 4)\), (3)
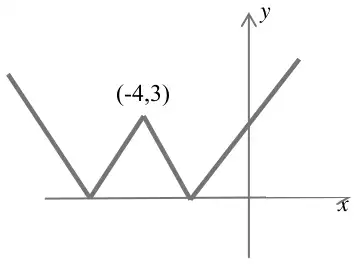
(b) \(y = \left|\mathrm{f}(-x)\right|\). (3)
On each diagram, show the coordinates of the point corresponding to \(R\).
| Scheme | Marks |
|---|---|
| V shape | B1 |
| vertex on \(y\) axis & both branches of graph cross \(x\) axis | B1 |
| ‘\(y\)’ co-ordinate of \(R\) is \(-6\) | B1 |
| (3) |
| Scheme | Marks |
|---|---|
| W shape | B1 |
| 2 vertices on the negative \(x\) axis. W in both quad 1 & quad 2. | B1dep |
| \(R' = (-4, 3)\) | B1 |
| (3) | |
| (6 marks) |