
C3 January 2006 Q1
1.
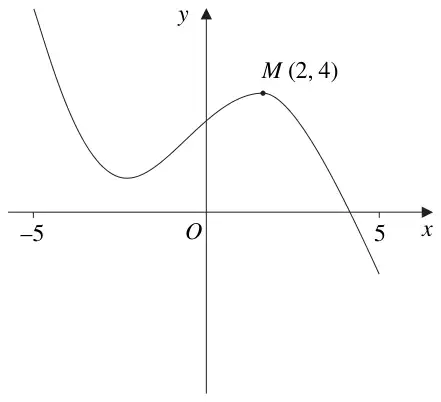
Figure 1 shows the graph of \(y = \mathrm{f}(x)\), \(-5 \leqslant x \leqslant 5\).
The point \(M\ (2, 4)\) is the maximum turning point of the graph.
Sketch, on separate diagrams, the graphs of
(a) \(y = \mathrm{f}(x) + 3\), (2)
(b) \(y = |\mathrm{f}(x)|\), (2)
(c) \(y = \mathrm{f}(|x|)\). (3)
Show on each graph the coordinates of any maximum turning points.
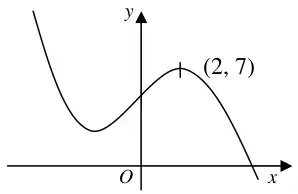
| Scheme | Marks |
|---|---|
| Shape unchanged | B1 |
| Point | B1 |
| (2) |
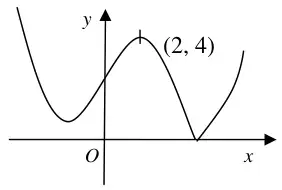
| Scheme | Marks |
|---|---|
| Shape | B1 |
| Point | B1 |
| (2) |
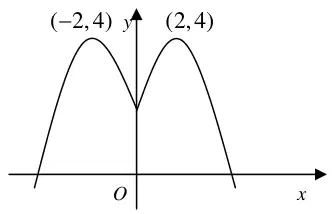
| Scheme | Marks |
|---|---|
| Shape | B1 |
| \((2, 4)\) | B1 |
| \((-2, 4)\) | B1 |
| (3) | |
| (7 marks) |