
C3 June 2005 Q6
6.
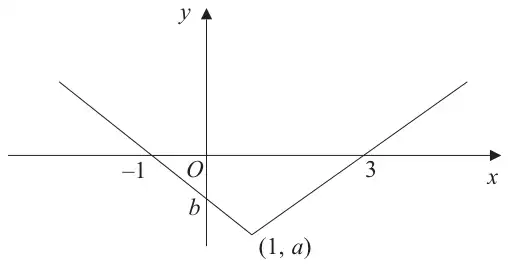
Figure 1 shows part of the graph of \(y = \mathrm{f}(x)\), \(x \in \mathbb{R}\). The graph consists of two line segments that meet at the point \((1, a)\), \(a \lt 0\). One line meets the \(x\)-axis at \((3, 0)\). The other line meets the \(x\)-axis at \((-1, 0)\) and the \(y\)-axis at \((0, b)\), \(b \lt 0\).
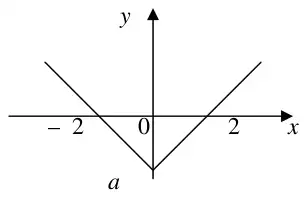
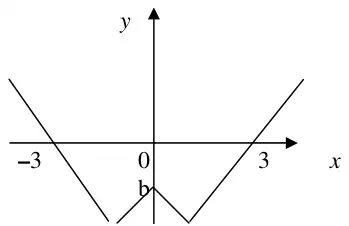
In separate diagrams, sketch the graph with equation
Indicate clearly on each sketch the coordinates of any points of intersection with the axes.
Given that \(\mathrm{f}(x) = |x - 1| - 2\), find
| Scheme | Marks |
|---|---|
| Translation \(\leftarrow\) by 1 | M1 |
| Intercepts correct | A1 |
| (2) |
| Scheme | Marks |
|---|---|
| \(x \geqslant 0\), correct “shape” provided graph is not original graph | B1 |
| Reflection in \(y\)-axis | B1ft |
| Intercepts correct | B1 |
| (3) |
| Scheme | Marks |
|---|---|
| \(a = -2,\quad b = -1\) | B1 B1 |
| (2) |
| Scheme | Marks |
|---|---|
| Intersection of \(y = 5x\) with \(y = -x - 1\) | M1 A1 |
| Solving to give \(x = -\tfrac{1}{6}\) | M1 A1 |
| (4) | |
| (11 marks) |
Notes
(i) If both values found for \(5x = -x - 1\) and \(5x = x - 3\), or solved algebraically, can score 3 out of 4 for \(x = -\tfrac{1}{6}\) and \(x = -\tfrac{3}{4}\); required to eliminate \(x = -\tfrac{3}{4}\) for final mark.
(ii) Squaring approach: M1 correct method, \(24x^2 + 22x + 3 = 0\) (correct 3 term quadratic, any form) A1
Solving M1, Final correct answer A1.