(a) The masses, \(m\) kg, of some parcels are shown below.
4 15 14 11 12 3 1 18 13 2 16 10
Jack constructs this grouped frequency table to record the masses.
Mass (m kg)
Tally
Frequency
\(0 \leqslant m \leqslant 5\)
\(5 \leqslant m \leqslant 10\)
\(10 \leqslant m \leqslant 15\)
\(15 \leqslant m \leqslant 20\)
Explain why Jack’s table is unsuitable to record the masses. [1]
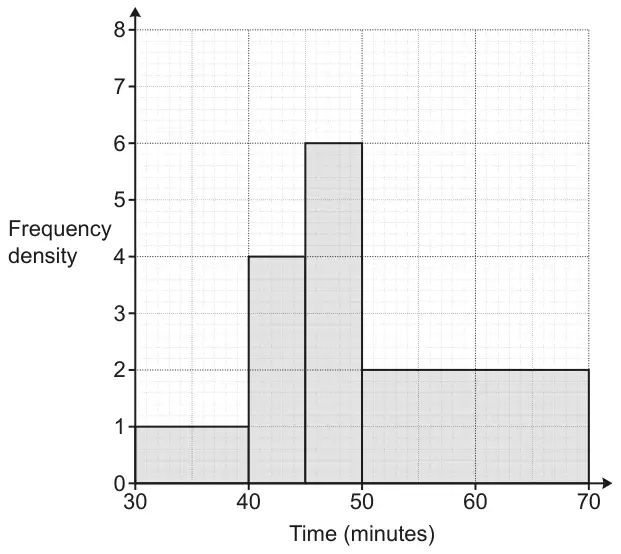
(b) The histogram summarises the times taken, in minutes, by some students to complete a race.
(i) Show that 70 students took between 45 and 70 minutes to complete the race. [2]
(ii) Calculate an estimate of the mean time taken to complete the race. Show your working. [5]
Mark scheme (a)
Answer
Marks
Part marks and guidance
Refers to overlapping intervals
1
eg 10 could go into 2 intervals The same number can go in 2 places Upper value in interval should be < Both inequalities are ≤ when only one should be
Mark scheme (b)
Answer
Marks
Part marks and guidance
(i) 5 × 6 and 2 × 20
2
M1 for 5 × 6 or 2 × 20
Could be written on graph Allow eg 2 × 10 + 2 × 10 for 2 × 20 Not just 30 + 40, must show products
(ii) 50.25 with correct working
5
B1 for frequencies 10, 20, 30, 40 M1 for mid-interval values 35, 42.5, 47.5, 60 soi M1 for \(\sum ft\) where \(t\) is in the interval including boundaries FT their frequencies
M1 for \(\sum ft \div \sum f\) dep on previous M1 FT their frequencies
If 0 scored, SC2 for answer 50.25 or SC1 for 5025 with no working
“Correct working” requires evidence of at least B1M1M1 Condone 1 error, could be on graph,