
Higher November 2017 Paper 4 Q10
10 The histogram summarises a health score for a group of people.
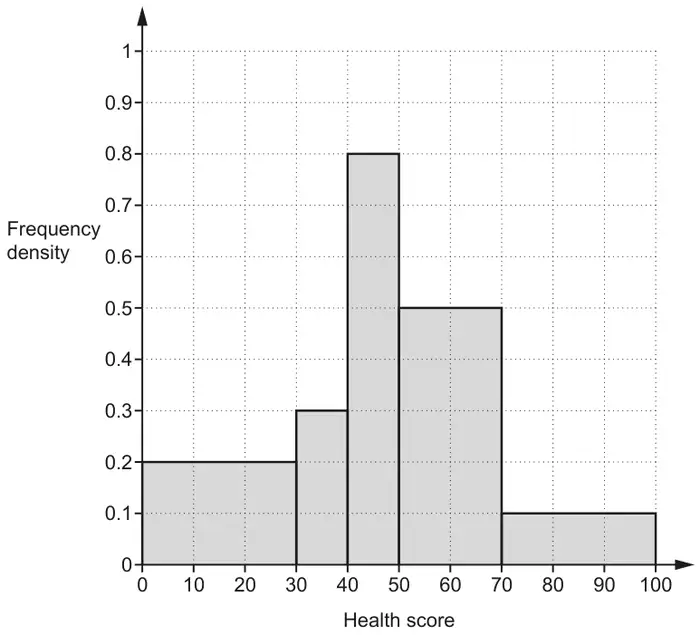
(a) Estimate the fraction of the group who had a score of 45 or more. [4]
(b) What assumption did you make in answering part (a)? [1]
| Answer | Marks | Part marks and guidance | |
|---|---|---|---|
| \(\dfrac{17}{30}\) | 4 | B2 for \(\frac{17}{3}\) OR M2 for 30×0.1+20×0.5+10×0.8+ 10×0.3+30×0.2 soi by 30 or M1 for three correct frequencies from 3, 10, 8, 3 and 6. and M1 for 3 + 10 + 4 or 17 | It can be done with probabilities |
| Answer | Marks | Part marks and guidance | |
|---|---|---|---|
| They were evenly spread out in the 40 – 50 class | 1 | accept any correct statement e.g. half the people in the 40 – 50 got over 45 | |
Notes
(corrected from the printed mark scheme: the appendix heading for these exemplars is printed as “Q9(b)”)
Appendix: exemplar responses for Q10(b)
| Response | Mark |
|---|---|
| They were evenly spread out in the 40 – 50 class | 1 |
| Half are under 45 and half are over 45 | 1 |