
Higher June 2019 Paper 4 Q14
14 The graph shows the speed of a train during the first 60 seconds of motion.
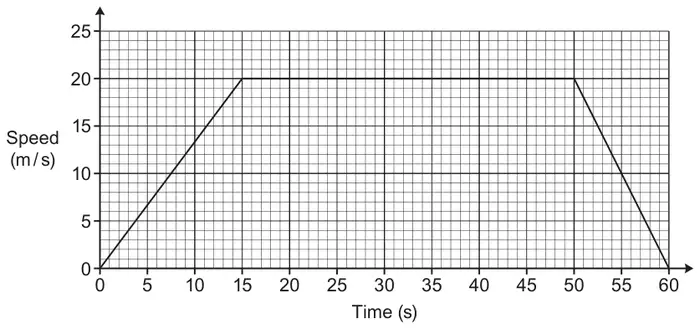
(a) What is the speed of the train after 9 seconds? [1]
(b) What does the straight line suggest about the speed of the train over the first 15 seconds? [1]
(c) Work out the average speed of the train, in m / s, during the 60 seconds. [5]
| Answer | Marks | Part marks and guidance | |
|---|---|---|---|
| 12 | 1 | condone “greater than 12” or “\(\gt 12\)” | |
| Answer | Marks | Part marks and guidance | |
|---|---|---|---|
| Acceleration is constant oe | 1 | see appendix for acceptable answers | |
Appendix: exemplar responses for Q14(b)
| Response | Mark |
|---|---|
| Acceleration is constant | 1 |
| [Speed] increases by the same amount each time | 1 |
| It accelerates most over the first 15 seconds | 1 BOD |
| Increasing [its speed] | 1 BOD |
| steadily increasing pace | 1 |
| It is steady | 0 |
| [Speed] is constant | 0 |
| Increasing acceleration | 0 |
| Answer | Marks | Part marks and guidance | |
|---|---|---|---|
| 15.8[3…] or 16 if no evidence of incorrect working | 5 | M1 for attempt to find an area under the graph (eg \(\frac{1}{2} \times 15 \times 20\)) soi by e.g. 150, 700, 100 or 950 M2 for \(\frac{1}{2}[(50 - 15) + 60] \times 20\) oe or 950 or M1 for a total area attempt with one error M1dep for their 950 ÷ 60, dep. on attempt at total area under graph | |
Appendix: Question 14(c)
950 scores 3 marks.