
Higher June 2019 Paper 4 Q6
6 120 students in Year 10 and Year 11 sit a test.
- 61 of the students are in Year 10.
- 83 of the students are right-handed.
- 20 of the students in Year 11 are left-handed.
One of the students in Year 10 and one of the students in Year 11 are chosen at random.
Which one is more likely to be left-handed?
Show your working. You may use the table if you wish. [6]
| Answer | Marks | Part marks and guidance | |
|---|---|---|---|
| [Year 10] [left] 17 and [total] 61 [Year 11] [left] 20 and [total] 59 and a comparison such as there are more Year 11 left-handers [than Y10] and there are fewer Year 11s [than Y10] in total or two comparable figures e.g. \(\left[\frac{17}{61} =\right]\) .28 or .279 or .27[8…] or 28% or \(\frac{1003}{3599}\) oe \(\left[\frac{20}{59} =\right]\) .34 or .339 or .33[8…] or 34% or \(\frac{1220}{3599}\) oe and conclusion e.g. Y11 | 6 | B5 for [Year 10] 17 with 61, and [Year 11] 20 with 59 (eg as fractions, or “out of”) and B1 for a comparison and conclusion e.g. two comparable figures or a statement such as “there are more Year 11 left-handers [than Y10] and there are fewer Year 11s [than Y10] in total …….” or the following marks may be seen in their working or in the table B4 for [Year 10] 17 with 61 and [Year 11] 20 with 59 or B3 for [Year 10] 17 with 61 or [Year 11] 20 with 59 or B2 for 17 or both 37 and 59 or B1 for 37 or 59 if percentages used we must see % sign or use “out of 100 people …” | |
Appendix: Question 6 alternatives
e.g. use of table
| L | R | ||
|---|---|---|---|
| Y10 | 17 | 61 | |
| Y11 | 20 | 59 | |
| 37 | 83 | 120 |
or
e.g. use of Venn diagram
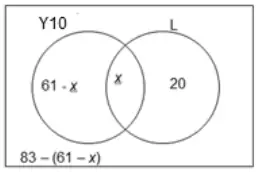
\(61 - x + x + 20 + 83 - (61 - x) = 120\) oe
\(x = 17\)
M1 for Venn Diagram with elements as shown oe
A1 for their \(x = 17\)