10 The cumulative frequency table shows information about the times, in minutes, taken by 40 people to complete a puzzle.
Time (\(m\) minutes)
Cumulative frequency
\(20 \lt m \leqslant 40\)
5
\(20 \lt m \leqslant 60\)
25
\(20 \lt m \leqslant 80\)
35
\(20 \lt m \leqslant 100\)
38
\(20 \lt m \leqslant 120\)
40
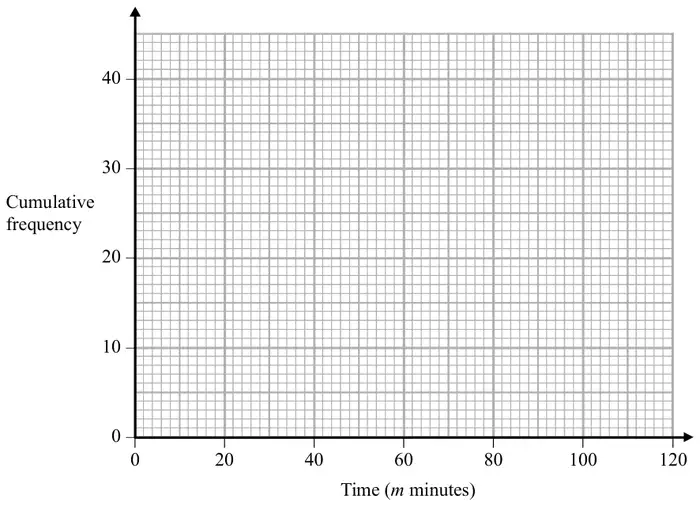
(a) On the grid below, draw a cumulative frequency graph for this information.(2)
(b) Use your graph to find an estimate for the interquartile range. (2)
One of the 40 people is chosen at random.
(c) Use your graph to find an estimate for the probability that this person took between 50 minutes and 90 minutes to complete the puzzle. (2)
Mark scheme (a)
Answer
Mark
Mark scheme
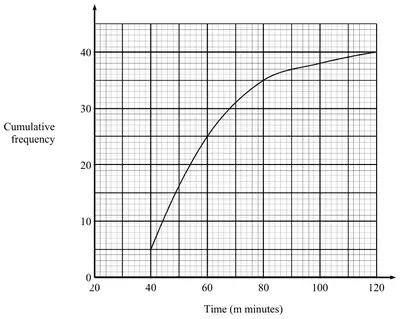
cf graph through (40, 5), (60, 25), (80, 35), (100, 38) and (120, 40)
C2
for a complete and accurate cf graph
(C1
for at least 4 or 5 cf values plotted correctly)
SC: B1 for 4 or 5 points plotted not at end but consistently within each interval and joined provided no gradient is negative
Additional guidance
May be a cumulative frequency curve or a cumulative frequency polygon Ignore any graph drawn to the left of the first point If histograms drawn, plots must be identified
Mark scheme (b)
Answer
Mark
Mark scheme
answer in range 21 to 28
M1
for UQ in the range 66 to 70 or LQ in the range 42 to 46 or ft their cf graph
A1
for answer in range 21 to 28 or ft their cf graph
Mark scheme (c)
Answer
Mark
Mark scheme
answer in the range \(\dfrac{19}{40}\) to \(\dfrac{24}{40}\)
M1
for finding the difference between readings taken from the cf axis at points from a mark of 50 and a mark of 90 or ft their graph (if possible)
A1
for an answer in the range \(\dfrac{19}{40}\) to \(\dfrac{24}{40}\) or ft their cf graph
Additional guidance
Their graph must be a cf graph
Accept any equivalent fraction, decimal from 0.475 to 0.6 or percentage from 47.5% – 60%