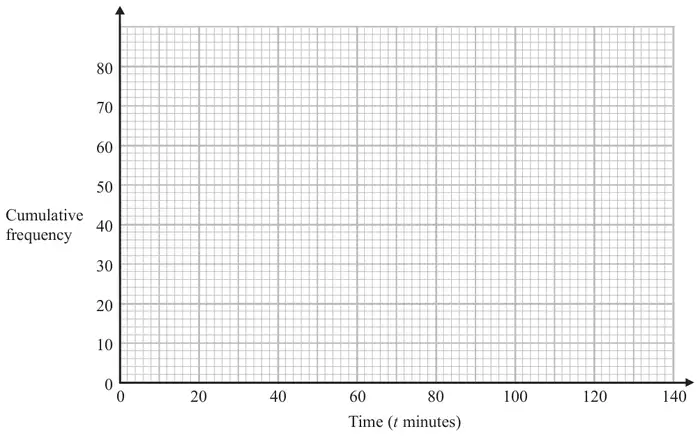
11 The grouped frequency table gives information about the times, in minutes, that 80 office workers take to get to work.
Time (\(t\) minutes)
Frequency
\(0 \lt t \leqslant 20\)
5
\(20 \lt t \leqslant 40\)
30
\(40 \lt t \leqslant 60\)
20
\(60 \lt t \leqslant 80\)
15
\(80 \lt t \leqslant 100\)
8
\(100 \lt t \leqslant 120\)
2
(a) Complete the cumulative frequency table.
Time (\(t\) minutes)
Cumulative frequency
\(0 \lt t \leqslant 20\)
\(0 \lt t \leqslant 40\)
\(0 \lt t \leqslant 60\)
\(0 \lt t \leqslant 80\)
\(0 \lt t \leqslant 100\)
\(0 \lt t \leqslant 120\)
(1)
(b) On the grid, draw the cumulative frequency graph for this information.(2)
(c) Use your graph to find an estimate for the percentage of these office workers who take more than 90 minutes to get to work. (3)
Mark scheme (a)
Answer
Mark
Mark scheme
5, 35, 55, 70, 78, 80
B1
cao
Mark scheme (b)
Answer
Mark
Mark scheme
cf graph
M1
for 5 or 6 of their points plotted correctly from a cf table
A1
for a fully correct graph
SC B1 if 5 or 6 of their points plotted not at end but consistent within each interval and joined by a curve or line segments providing no gradient is negative
Additional guidance
Ignore to the left of the first point and right of the last point
Accept a smooth curve or line segments
Mark scheme (c)
Answer
Mark
Mark scheme
7.5
M1
for a clear method to read off the cf graph at 90
M1
for a full method to find the percentage eg \((80 - \text{``}74\text{''}) \div 80 \times 100\ (= 7.5)\)
A1
for 7.5 or ft cf graph
Additional guidance
Sight of 74 or 6 implies M1
The following readings give the following percentages 72 = 10% 73 = 8.75% 74 = 7.5% 75 = 6.25% 76 = 5%