
Higher November 2018 Paper 3 Q4
4 Fran asks each of 40 students how many books they bought last year.
The chart below shows information about the number of books bought by each of the 40 students.
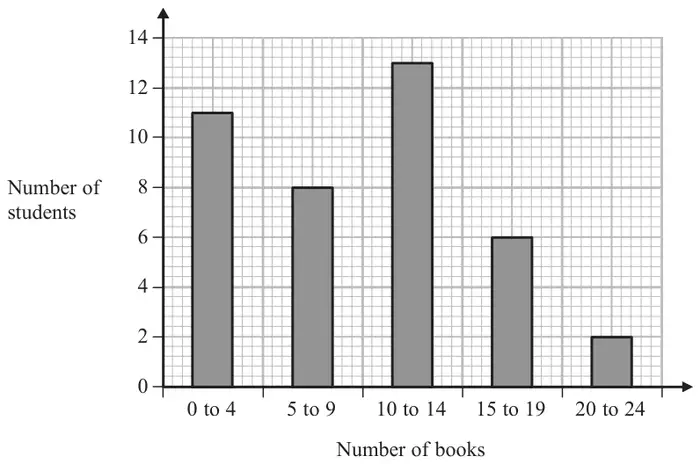
(a) Work out the percentage of these students who bought 20 or more books. (2)
(b) Show that an estimate for the mean number of books bought is 9.5
You must show all your working. (4)
You must show all your working. (4)
| Answer | Mark | Mark scheme |
|---|---|---|
| 5 | M1 | \(\text{``}2\text{''} \div 40 \times 100\) |
| A1 | cao |
Additional guidance
“2” comes from their reading of the height of the 20 to 24 column
| Answer | Mark | Mark scheme |
|---|---|---|
| 9.5 shown | M1 | for frequencies of 11, 8, 13, 6 and 2 (allow one error) or for midpoints 2, 7, 12, 17 and 22 |
| M1 | for finding at least 4 products \(fx\) consistently within interval (including end points) | |
| M1 | for \(\Sigma\text{``}fx\text{''} \div (\text{``}11\text{''} + \text{``}8\text{''} + \text{``}13\text{''} + \text{``}6\text{''} + \text{``}2\text{''})\) or \((11 \times 2 + 8 \times 7 + 13 \times 12 + 6 \times 17 + 2 \times 22) \div 40\) OR \(\Sigma\text{``}fx\text{''}\) (=380) and \(9.5 \times (\text{``}11\text{''} + \text{``}8\text{''} + \text{``}13\text{''} + \text{``}6\text{''} + \text{``}2\text{''})\) (=380) | |
| C1 | for correct figures showing the answer or accurate figures to compare from correct working eg 380 from two calculations |
Additional guidance
May be seen on chart
Evidence of two different calculations that should lead to 380 are required for this mark