
Foundation June 2018 Paper 1 Q12
12 A shop sells desktop computers, laptops and tablets.
The composite bar chart shows information about sales over the last three years.
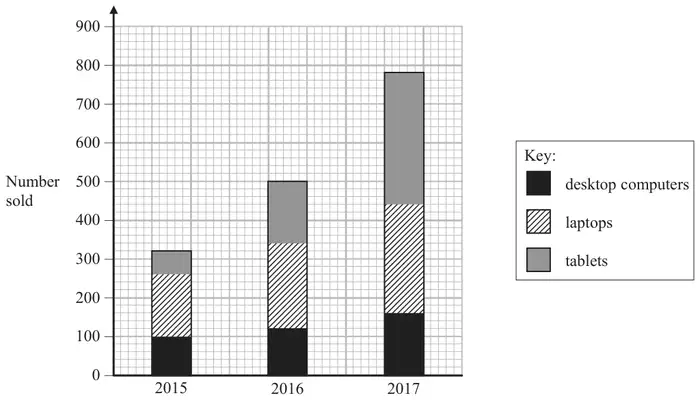
(a) Write down the number of desktop computers sold in 2015 (1)
(b) Work out the total number of laptops sold in the 3 years. (3)
(c) State the item that had the greatest increase in sales over the 3 years.
Give a reason for your answer. (2)
Give a reason for your answer. (2)
Alex says,
“In 2017, more tablets were sold than desktop computers. This means the shop makes more profit from the sale of tablets than from the sale of desktop computers.”
(d) Is Alex correct?
You must justify your answer. (1)
You must justify your answer. (1)
| Answer | Mark | Mark scheme |
|---|---|---|
| 100 | B1 | for answer in the range 95 to 100 |
| Answer | Mark | Mark scheme |
|---|---|---|
| 660 | M1 | for reading at least 3 of the required figures from the graph eg 3 of “100”, 260, 120, 340, 160, 440 OR for \(260 - \text{``}100\text{''}\ (= 160)\) or \(340 - 120\ (= 220)\) or \(440 - 160\ (= 280)\) OR for \(\text{``}100\text{''} + 60\ (= 160)\) or \(80 + 100 + 40\ (= 220)\) or \(40 + 100 + 100 + 40\ (= 280)\) |
| M1 | (dep) for adding their 3 differences eg \(\text{``}160\text{''} + \text{``}220\text{''} + \text{``}280\text{''}\) | |
| A1 | for 660 or ft their answer to part (a) |
Additional guidance
Figures may be seen on graph
| Answer | Mark | Mark scheme |
|---|---|---|
| Tablets | B1 | Tablets |
| and statement | C1 | Statement eg the bars get proportionally longer over time (most in 2017 and least in 2015) or they (more than) double each year or for an increase of 280 or numbers range from 60 to 340 |
Additional guidance
Values quoted for tablets must be correct.
Ignore any calculations relating to laptops and/or desktop computers whether correct or not.
Award previous mark if “tablets” is not specifically stated but can be implied from statement.
| Answer | Mark | Mark scheme |
|---|---|---|
| Statement (supported) | C1 | for statement, eg (No because) we do not know costs or prices or profit. |
Additional guidance
Answer of ‘Yes’ gets C0
Answer of ‘No’ without justification gets C0