
Foundation November 2021 Paper 3 Q18
18 The scatter diagram shows the age and value of some cars in 2019
All the cars were of the same make and model.
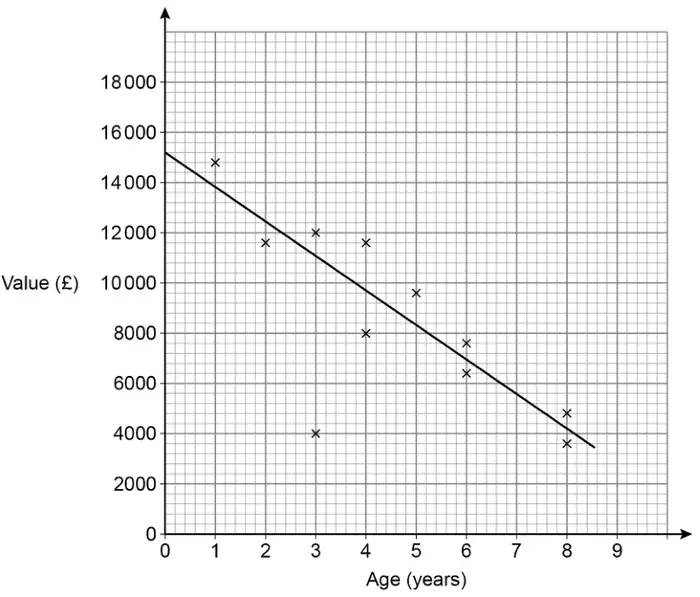
(a) What type of correlation does the scatter graph show? [1 mark]
(b) Write down the value of the car that was an outlier. [1 mark]
(c) Use the graph to estimate the value of a new car of this make and model in 2019 [1 mark]
(d) A car of this make and model had a value of £5600 in 2019
Use the graph to estimate the year in which it was made. [2 marks]
| Answer | Mark | Comments |
|---|---|---|
| Negative | B1 | ignore descriptive words eg strong |
Additional guidance
| Description of relationship only eg as the car gets older the value goes down | B0 |
| Answer | Mark | Comments |
|---|---|---|
| 4000 | B1 |
Additional guidance
| (3, 4000) | B0 |
| Answer | Mark | Comments |
|---|---|---|
| [15 000, 15 400] | B1 |
| Answer | Mark | Comments |
|---|---|---|
| 2012 | B2 | B1 horizontal line at 5600 \(\pm\,\dfrac{1}{2}\) small square or [6.8, 7.2] implied by mark in correct place on line or horizontal axis |
Additional guidance
| 2012 and 7 on answer line | B2 |