
Higher November 2021 Paper 3 Q21
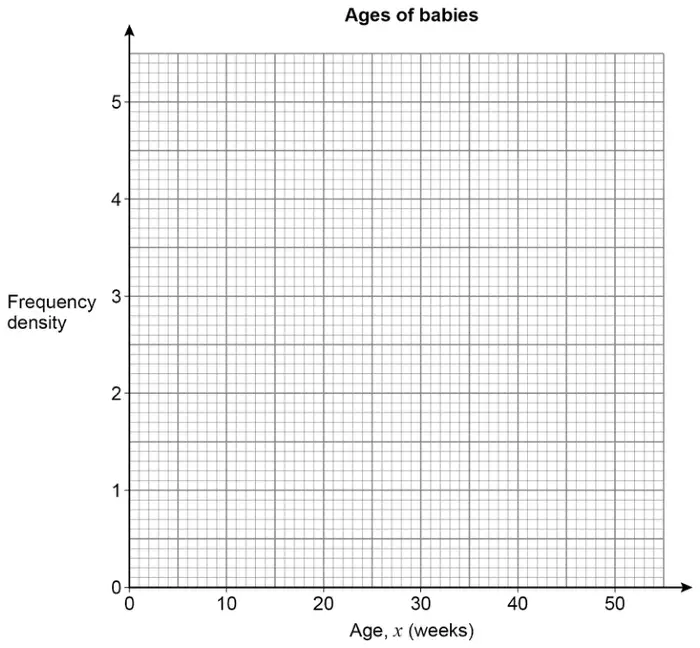
21 Here is some information about the ages of babies at a clinic.
| Age, \(x\) (weeks) | Frequency | ||
|---|---|---|---|
| \(0 \leqslant x \lt 5\) | 18 | ||
| \(5 \leqslant x \lt 10\) | 23 | ||
| \(10 \leqslant x \lt 20\) | 17 | ||
| \(20 \leqslant x \lt 50\) | 21 |
Draw a histogram to represent the information. [4 marks]
| Answer | Mark | Comments |
|---|---|---|
| (Class widths are) 5, 5, 10, 30 | M1 | |
| \(18 \div 5\) or 3.6 or \(23 \div 5\) or 4.6 or \(17 \div 10\) or 1.7 or \(21 \div 30\) or 0.7 | M1 | implied by correct bar |
| Any three of \(18 \div 5\) or 3.6 and \(23 \div 5\) or 4.6 and \(17 \div 10\) or 1.7 and \(21 \div 30\) or 0.7 | M1dep | implied by correct bars |
| All bars correct | A1 | \(\pm\dfrac{1}{2}\) square |
Additional guidance
Four correct frequency density values imply first M1