
Higher June 2022 Paper 1 Q17
17 75 people attend a clinic.
Their ages are recorded and a cumulative frequency diagram is drawn.
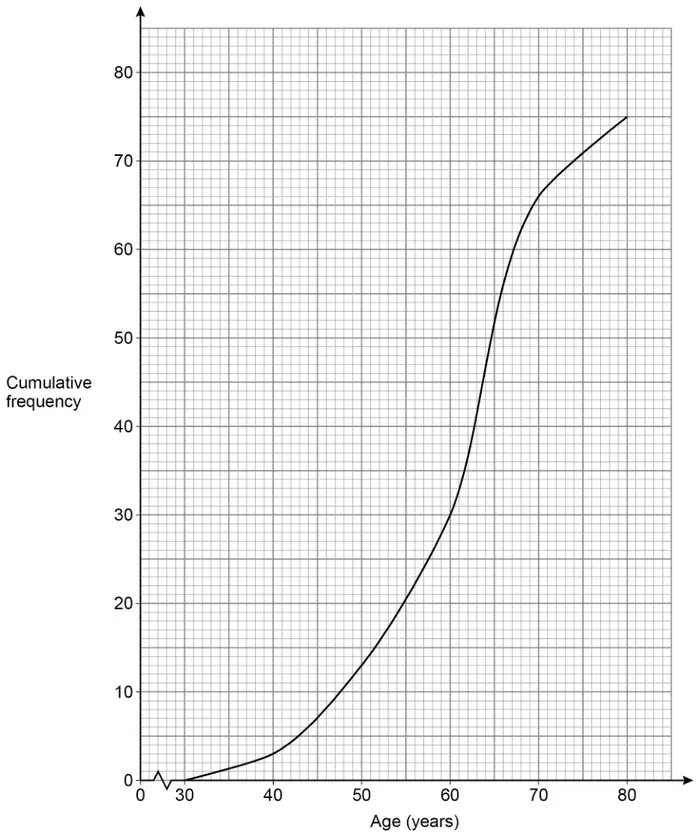
A nurse makes a statement about the ages of the people at the clinic.
He says,
“More than twice as many people are in their 60s as in their 50s.”
Is he correct?
Tick a box.
- Yes
- No
Show working to support your answer. [3 marks]
| Answer | Mark | Comments |
|---|---|---|
| Any two correct readings of 13 at 50 (years) 30 at 60 (years) 66 at 70 (years) | B1 | may be seen on the graph implied by a difference (frequency) of 17 for 50s or 36 for 60s |
| Correct difference (frequency) for any two readings eg difference (frequency) of 14 for readings of 7 at 45 (years) and 21 at 55 (years) | M1 | must be from two readings correct for those ages a difference (frequency) of 17 for 50s or 36 for 60s scores B1M1 |
| 17 and 36 and Yes | A1 | Yes can be implied eg \(34 \lt 36\) |
Additional guidance
| Readings of 3, 13 and 30 (from 40, 50 and 60) with differences (frequencies) of 10 and 17 | B1M1A0 |
| Award the B1 mark for any two of the three possible correct readings, even if multiple readings are taken from the graph | |
| Their readings and differences (frequencies) must be integers to gain marks | |
| For readings not giving an integer value allow the integer above or below the reading eg for a reading at 53 allow 17 or 18 | |
| Readings of 11 or 12 at 49, 27 or 28 at 59 and 64 or 65 at 69, leading to differences (frequencies) of 15, 16 or 17 and 36, 37 or 38 | B0M1A0 |
| Differences (frequencies) other than 17 and 36 must come from readings seen on the graph or linked to ages in working |