
A2 June 2023 Q2
2.
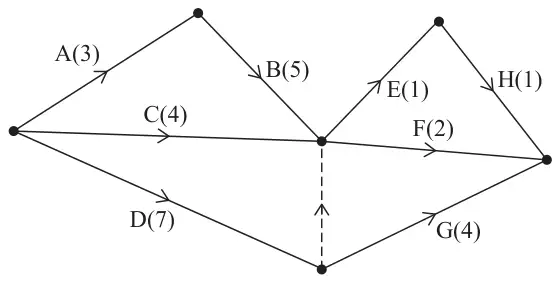
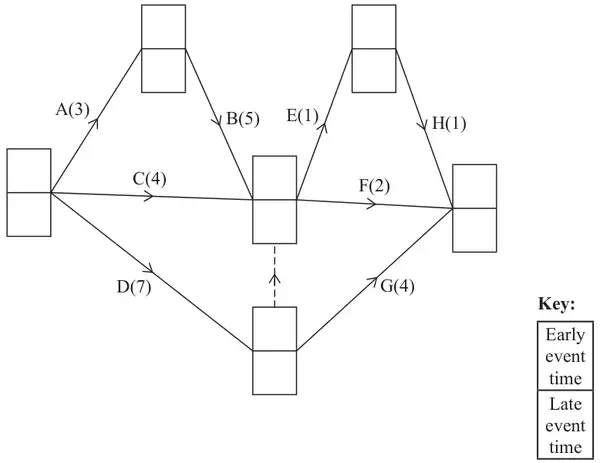
The network in Figure 3 shows the activities that need to be undertaken to complete a project. Each activity is represented by an arc and the duration, in hours, of the corresponding activity is shown in brackets.
The table below lists the number of workers required for each activity in the project.
| Activity | Number of workers |
|---|---|
| A | 2 |
| B | 1 |
| C | 2 |
| D | 2 |
| E | 3 |
| F | 2 |
| G | 1 |
| H | 3 |
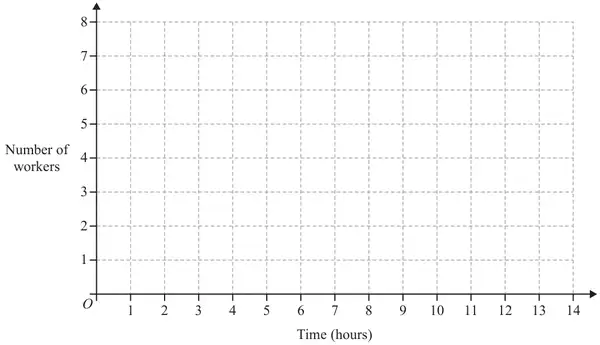
Each worker is able to do any of the activities. Once an activity is started it must be completed without interruption. It is given that each activity begins at its earliest possible start time.
| Scheme | Marks | AO |
|---|---|---|
(i)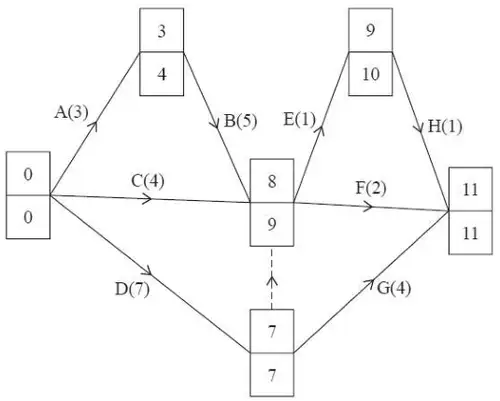 | M1 A1 | 1.1b 1.1b |
| (ii) 11 (hours) | A1ft | 2.2a |
| (3) |
Notes
(a)(i)
M1: All top boxes and all bottom boxes completed. Values generally increasing left to right (for top boxes) and values generally decreasing from right to left (for bottom boxes). Condone missing 0s at the source node and/or their 11 in the bottom box at the sink node for M only. Condone one rogue value in top boxes and one rogue value in bottom boxes. For a rogue in the top boxes if values do not increase in the direction of the arrows then if one value is ignored and then the values do increase in the direction of the arrows then this is considered to be only one rogue value (with a similar definition for bottom boxes but in reverse)
A1: CAO - Top boxes and Bottom boxes (all completed)
(ii)
A1ft: Follow through their final early event time (the final late event time does not need to be the same as the final early event time to award this mark) – units not required and ignore incorrect units (just mark the value stated)
| Scheme | Marks | AO |
|---|---|---|
(i)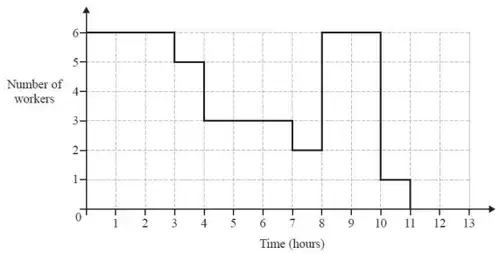 | M1 A1 A1 | 1.1b 1.1b 1.1b |
| (ii) Six workers are required in the time intervals 0 – 3 and 8 – 10 | A1 | 2.2a |
| (4) | ||
| (7 marks) |
Notes
(b)(i) Do not consider the placement of the activities (if shown) in the histogram – consider only the placement of each vertical bar
M1: Plausible histogram (correct up to time 4) with no holes or overhangs (must go to at least 10 on the time axis)
A1: Histogram correct to time 8
A1: Histogram correct from time 8 to time 11 with no activities taking place after time 11
(b)(ii)
A1: CAO (0 to 3 and 8 to 10) – allow any indication of an interval from 0 to 3 and 8 to 10 (so accept any use of \(\lt, \leqslant\) or just a dash but not, for example, 0 to 2.999…)