
October 2020 Paper 1 Q7
7.
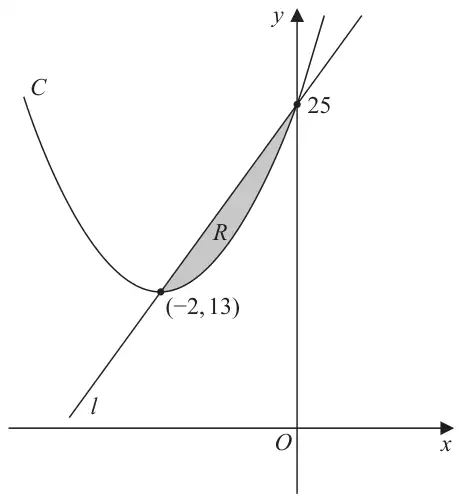
Figure 1 shows a sketch of a curve \(C\) with equation \(y = \mathrm{f}(x)\) and a straight line \(l\).
The curve \(C\) meets \(l\) at the points \((-2, 13)\) and \((0, 25)\) as shown.
The shaded region \(R\) is bounded by \(C\) and \(l\) as shown in Figure 1.
Given that
- \(\mathrm{f}(x)\) is a quadratic function in \(x\)
- \((-2, 13)\) is the minimum turning point of \(y = \mathrm{f}(x)\)
use inequalities to define \(R\). (5)
| Scheme | Marks | AO |
|---|---|---|
| Attempts equation of line Eg Substitutes \((-2, 13)\) into \(y = mx + 25\) and finds \(m\) | M1 | 1.1b |
| Equation of \(l\) is \(y = 6x + 25\) | A1 | 1.1b |
| Attempts equation of \(C\) Eg Attempts to use the intercept \((0, 25)\) within the equation \(y = a(x \pm 2)^2 + 13,\) in order to find \(a\) | M1 | 3.1a |
| Equation of \(C\) is \(y = 3(x+2)^2 + 13\) or \(y = 3x^2 + 12x + 25\) | A1 | 1.1b |
| Region \(R\) is defined by \(3(x+2)^2 + 13 \lt y \lt 6x + 25\) o.e. | B1ft | 2.5 |
| (5) | ||
| (5 marks) |
Notes
The first two marks are awarded for finding the equation of the line
M1: Uses the information in an attempt to find an equation for the line \(l\).
E.g. Attempt using two points: Finds \(m = \pm\dfrac{25-13}{2}\) and uses of one of the points in their \(y = mx + c\) or equivalent to find \(c\). Alternatively uses the intercept as shown in main scheme.
A1: \(y = 6x + 25\) seen or implied. This alone scores the first two marks. Do not accept \(l = 6x + 25\)
It must be in the form \(y = \ldots\) but the correct equation can be implied from an inequality. E.g. \(\ldots \lt y \lt 6x + 25\)
The next two marks are awarded for finding the equation of the curve
M1: A complete method to find the constant \(a\) in \(y = a(x \pm 2)^2 + 13\) or the constants \(a, b\) in \(y = ax^2 + bx + 25\).
An alternative to the main scheme is deducing equation is of the form \(y = ax^2 + bx + 25\) and setting and solving a pair of simultaneous equations in \(a\) and \(b\) using the point \((-2, 13)\) the gradient being 0 at \(x = -2\). Condone slips. Implied by \(C = 3x^2 + 12x + 25\) or \(3x^2 + 12x + 25\)
FYI the correct equations are \(13 = 4a - 2b + 25\ (2a - b = -6)\) and \(-4a + b = 0\)
A1: \(y = 3(x+2)^2 + 13\) or equivalent such as \(y = 3x^2 + 12x + 25\), \(\mathrm{f}(x) = 3(x+2)^2 + 13\).
Do not accept \(C = 3x^2 + 12x + 25\) or just \(3x^2 + 12x + 25\) for the A1 but may be implied from an inequality or from an attempt at the area, E.g. \(\displaystyle\int 3x^2 + 12x + 25\,\mathrm{d}x\)
B1ft: Fully defines the region \(R\). Follow through on their equations for \(l\) and \(C\).
Allow strict or non -strict inequalities as long as they are used consistently.
E.g. Allow for example "\(3(x+2)^2 + 13 \lt y \lt 6x + 25\)" "\(3(x+2)^2 + 13 \leqslant y \leqslant 6x + 25\)"
Allow the inequalities to be given separately, e.g. \(y \lt 6x + 25,\ y \gt 3(x+2)^2 + 13\). Set notation may be used so \(\left\{(x, y) : y \gt 3(x+2)^2 + 13\right\} \cap \left\{(x, y) : y \lt 6x + 25\right\}\) is fine but condone with or without any of \((x, y) \leftrightarrow y \leftrightarrow x\)
Incorrect examples include "\(y \lt 6x + 25\) or \(y \gt 3(x+2)^2 + 13\)", \(\left\{(x, y) : y \gt 3(x+2)^2 + 13\right\} \cup \left\{(x, y) : y \lt 6x + 25\right\}\)
Values of \(x\) could be included but they must be correct. So \(3(x+2)^2 + 13 \lt y \lt 6x + 25,\ x \lt 0\) is fine
If there are multiple solutions mark the final one.