
June 2022 Paper 2 Q6
6.
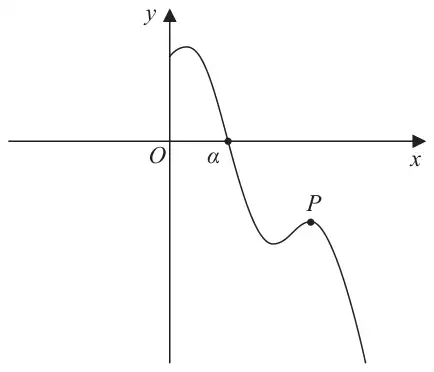
Figure 2 shows a sketch of part of the curve with equation \(y = \mathrm{f}(x)\) where
\[\mathrm{f}(x) = 8\sin\left(\dfrac{1}{2}x\right) - 3x + 9 \qquad x \gt 0\]and \(x\) is measured in radians.
The point \(P\), shown in Figure 2, is a local maximum point on the curve.
Using calculus and the sketch in Figure 2,
The curve crosses the \(x\)-axis at \(x = \alpha\), as shown in Figure 2.
Given that, to 3 decimal places, \(\mathrm{f}(4) = 4.274\) and \(\mathrm{f}(5) = -1.212\)
Show your method and give your answer to 3 significant figures. (2)
| Scheme | Marks | AO |
|---|---|---|
| \((\mathrm{f}^{\prime}(x) =)\,4\cos\left(\dfrac{1}{2}x\right) - 3\) | M1 A1 | 1.1b 1.1b |
| Sets \(\mathrm{f}^{\prime}(x) = 4\cos\left(\dfrac{1}{2}x\right) - 3 = 0 \Rightarrow x =\) | dM1 | 3.1a |
| \(x = 14.0\) Cao | A1 | 3.2a |
| (4) |
Notes
M1: Differentiates to obtain \(k\cos\left(\dfrac{1}{2}x\right) \pm \alpha\) where \(\alpha\) is a constant which may be zero and no other terms. The brackets are not required.
A1: Correct derivative \(\mathrm{f}^{\prime}(x) = 4\cos\left(\dfrac{1}{2}x\right) - 3\). Allow unsimplified e.g. \(\mathrm{f}^{\prime}(x) = \dfrac{1}{2} \times 8\cos\left(\dfrac{1}{2}x\right) - 3x^0\)
There is no need for \(\mathrm{f}^{\prime}(x) = \ldots\) or \(\dfrac{\mathrm{d}y}{\mathrm{d}x} = \ldots\) just look for the expression and the brackets are not required.
dM1: For the complete strategy of proceeding to a value for \(x\).
Look for
- \(\mathrm{f}^{\prime}(x) = a\cos\left(\dfrac{1}{2}x\right) + b = 0,\quad a, b \neq 0\)
- Correct method of finding a valid solution to \(a\cos\left(\dfrac{1}{2}x\right) + b = 0\)
Allow for \(a\cos\left(\dfrac{1}{2}x\right) + b = 0 \Rightarrow \cos\left(\dfrac{1}{2}x\right) = \pm k \Rightarrow x = 2\cos^{-1}(\pm k)\) where \(\lvert k\rvert \lt 1\)
If this working is not shown then you may need to check their value(s).
For example \(4\cos\left(\dfrac{1}{2}x\right) - 3 = 0 \Rightarrow x = 1.4\ldots\) or \(11.1\ldots\) (or \(82.8\ldots\) or \(637\ldots\) or 803 in degrees) would indicate this method.
A1: Selects the correct turning point \(x = 14.0\) and not just 14 or unrounded e.g. \(14.011\ldots\)
Must be this value only and no other values unless they are clearly rejected or 14.0 clearly selected. Ignore any attempts to find the \(y\) coordinate.
Correct answer with no working scores no marks.
| Scheme | Marks | AO |
|---|---|---|
| Explains that \(\mathrm{f}(4) \gt 0,\ \mathrm{f}(5) \lt 0\) and the function is continuous | B1 | 2.4 |
| (1) |
Notes
B1: See scheme. Must be a full reason, (e.g. change of sign and continuous)
Accept equivalent statements for \(\mathrm{f}(4) \gt 0,\ \mathrm{f}(5) \lt 0\) e.g. \(\mathrm{f}(4) \times \mathrm{f}(5) \lt 0\), ”there is a change of sign”, “one negative one positive”. A minimum is “change of sign and continuous” but do not allow this mark if the comment about continuity is clearly incorrect e.g. “because \(x\) is continuous” or “because the interval is continuous”
| Scheme | Marks | AO |
|---|---|---|
| Attempts \(x_1 = 5 - \dfrac{8\sin 2.5 - 15 + 9}{\text{``}4\cos 2.5 - 3\text{''}}\) (NB \(\mathrm{f}(5) = -1.212\ldots\) and \(\mathrm{f}^{\prime}(5) = -6.204\ldots\)) | M1 | 1.1b |
| \(x_1 =\) awrt 4.80 | A1 | 1.1b |
| (2) | ||
| (7 marks) |
Notes
M1: Attempts \(x_1 = 5 - \dfrac{\mathrm{f}(5)}{\mathrm{f}^{\prime}(5)}\) to obtain a value following through on their \(\mathrm{f}^{\prime}(x)\) as long as it is a “changed” function.
Must be a correct N-R formula used – may need to check their values.
Allow if attempted in degrees. For reference in degrees f (5) = \(-5.65\ldots\) and f ′(5) = \(0.996\ldots\) and gives \(x_1 = 10.67\ldots\)
There must be clear evidence that \(5 - \dfrac{\mathrm{f}(5)}{\mathrm{f}^{\prime}(5)}\) is being attempted.
so e.g. \(x_{n+1} = x_n - \dfrac{\mathrm{f}(x_n)}{\mathrm{f}^{\prime}(x_n)} \Rightarrow x_1 = 4.80\) scores M0 as does e.g. \(x_1 = x - \dfrac{8\sin\left(\dfrac{1}{2}x\right) - 3x + 9}{4\cos\left(\dfrac{1}{2}x\right) - 3} = 4.80\)
BUT evidence may be provided by the accuracy of their answer. Note that the full N-R accuracy is 4.804624337 so e.g. 4.805 or 4.804 (truncated) with no evidence of incorrect work may imply the method.
A1: \(x_1 =\) awrt 4.80 not awrt 4.8 but isw if awrt 4.80 is seen. Ignore any subsequent iterations.
Note that work for part (a) cannot be recovered in part (c)
Note also:
\(5 - \dfrac{\mathrm{f}(5)}{\mathrm{f}^{\prime}(5)} =\) awrt 4.80 following a correct derivative scores M1A1
\(5 - \dfrac{\mathrm{f}(5)}{\mathrm{f}^{\prime}(5)} \neq\) awrt 4.80 with no evidence that \(5 - \dfrac{\mathrm{f}(5)}{\mathrm{f}^{\prime}(5)}\) was attempted scores M0