
June 2023 Paper 2 Q14
14 The pre-release material contains information concerning the median income of taxpayers in £ and the percentage of all pupils at the end of KS4 achieving 5 or more GCSEs at grade A*–C, including English and Maths, for different areas of London.
Some of the data for 2014/15 is shown in Fig. 14.1.
Fig. 14.1
| Median Income of Taxpayers in £ | Percentage of Pupils Achieving 5 or more A*–C, including English and Maths | |
|---|---|---|
| City of London | 61 100 | #N/A |
| Barking and Dagenham | 21 800 | 54.0 |
| Barnet | 27 100 | 70.1 |
| Bexley | 24 400 | 55.0 |
| Brent | 22 700 | 60.0 |
| Bromley | 28 100 | 68.0 |
A student investigated whether there is any relationship between median income of taxpayers and percentage of pupils achieving 5 or more GCSEs at grade A*–C, including English and Maths.
After the data was cleaned, the student used software to draw the scatter diagram shown in Fig. 14.2.
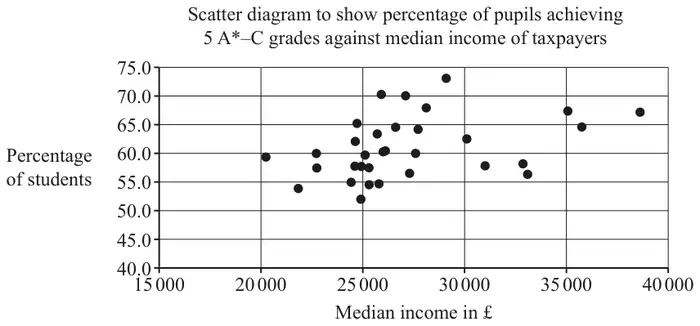
The student calculated that the product moment correlation coefficient for these data is 0.3743.
The student carried out some further analysis. The results are shown in Fig. 14.3.
Fig. 14.3
| median income of taxpayers in £ | percentage of pupils achieving 5+ A*–C | |
|---|---|---|
| mean | 27 216 | 61.0 |
| standard deviation | 4177.5 | 5.32 |
The student identified three outliers in total.
- Use the information in Fig. 14.3 to determine the range of values of the median income of taxpayers in £ which are outliers.
- Use the information in Fig. 14.3 to determine the range of values of the percentage of all pupils at the end of KS4 achieving 5 or more GCSEs at grade A*–C which are outliers.
- On the copy of Fig. 14.2 in the Printed Answer Booklet, circle the three outliers identified by the student.
The student decided to remove these outliers and recalculate the product moment correlation coefficient.
| Scheme | Marks | AO |
|---|---|---|
| discard City of London (as part of the data not available) or discard any regions where one or more pieces of data are missing oe | B1 | 2.4 |
| [1] |
Notes
B1: LDS advantage
do not allow if answer spoiled
eg because it’s an anomaly,
eg because it’s an outlier,
| Scheme | Marks | AO |
|---|---|---|
| scatter does not look linear oe | B1 | 3.4 |
| pmcc not close to 1 oe | B1 | 3.4 |
| [2] |
Notes
B1: ignore extra comments unless they contradict an otherwise correct answer
B1: ignore extra comments unless they contradict an otherwise correct answer
| Scheme | Marks | AO |
|---|---|---|
| \(27216 \pm 2 \times 4177.5\) or \(61.0 \pm 2 \times 5.32\) | M1 | 1.1 |
| \(m < 18861\) or \(m > 35\,571\) | A1 | 1.1 |
| percentage \(< 50.36\) or percentage \(> 71.64\) | A1 | 1.1 |
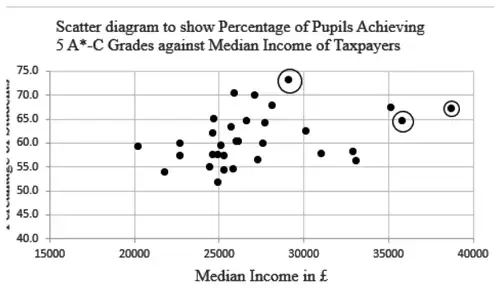 | A1 | 1.1 |
| [4] |
Notes
M1: use of 2 standard deviation check for one of the 4 calculations soi
A1: allow \(\leqslant\) and \(\geqslant\)
A1: allow \(\leqslant\) and \(\geqslant\)
if M1A0A0 allow M1 SCB1 for all 4 correct values seen
| Scheme | Marks | AO |
|---|---|---|
| between 0 and 0.3743 since eg outliers gave a false impression of linearity eg scatter will be more like a circle | B1 | 2.4 |
| [1] |
Notes
B1: need to refer to the shape of the scatter oe