
June 2025 Paper 2 Q15
15 A personal trainer is investigating whether, in the general population, there is any association between resting pulse rate in beats per minute and mean hours per week spent running.
One week he collects a sample by asking 25 of his clients for the relevant data.
A biologist researching the same topic collects a random sample of size 47. She represents the data using the scatter diagram shown below.
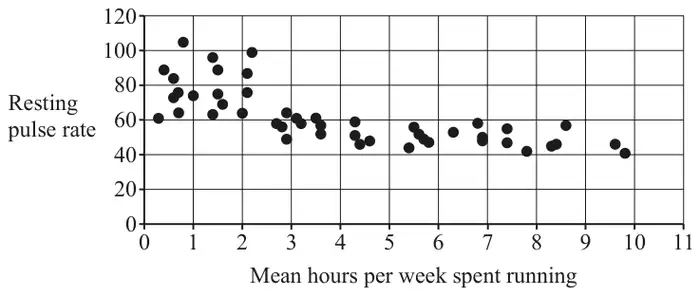
According to medical research, the normal resting pulse rate for an adult is between 60 and 110 beats per minute.
The biologist separates the data into a group to the left of the vertical line on the scatter diagram and a group to the right of the vertical line on the scatter diagram. She calculates Spearman’s rank correlation coefficient, \(r_s\), and the associated \(p\)-value for each group.
The results are shown in the table.
| Group | \(r_s\) | \(p\)-value |
|---|---|---|
| To the left of the vertical line | 0.209 36 | 0.419 98 |
| To the right of the vertical line | –0.613 49 | 0.000 31 |
| Scheme | Marks | AO |
|---|---|---|
| (i) opportunity (sampling) | B1 | 2.5 |
| [1] | ||
| (ii) only people known to the personal trainer / his clients sampled oe so eg they are fitter than typical members of the population oe eg sample may not be representative oe | B1 | 2.3 |
| [1] |
Notes
(i) B1: allow convenience (sampling)
do not allow eg convenient sampling; eg opportunistic sampling
(ii) B1: allow so
any eg which alludes to sample possibly giving unrepresentative values
| Scheme | Marks | AO |
|---|---|---|
| negative (association) | B1 | 2.4 |
| [1] |
Notes
B1: ignore adjectives such as weak, strong etc
allow
eg as mean hours spent running increases, resting pulse rate decreases;
eg negative relationship;
do not allow
eg (negative) correlation;
eg as pulse rate increases, mean hours per week spent running decreases
| Scheme | Marks | AO |
|---|---|---|
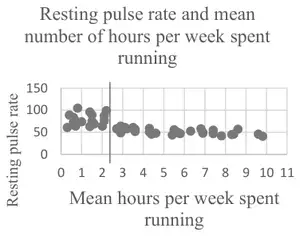 | B1 | 2.2b |
| [1] |
Notes
B1: approximately vertical line at about 2.5; B0 if more than one line
| Scheme | Marks | AO |
|---|---|---|
| LH region 0.20936 is (fairly) small oe isw | B1 | 3.4 |
| 0.41998 is not close to 0 oe isw | M1 | 3.4 |
| insufficient evidence to suggest association (between mean time spent running and resting pulse rate) oe | A1 | 2.2b |
| RH region –0.61349 is closer to –1 than 0 oe isw | B1 | 3.4 |
| 0.00031is close to 0 oe | M1 | 3.4 |
| sufficient evidence to suggest (some) [negative] association (between mean time spent running and resting pulse rate) oe | A1 | 2.2b |
| [6] |
Notes
B1: allow eg \(r_s\) is closer to 0 than to 1;
eg low value of \(r_s\); eg allow \(r_s\) close to 0
M1: allow eg \(p\)-value \(\gt\) 0.05 (or 0.01 or 0.1)
eg \(p\)-value not small
do not allow
eg \(p\)-value (relatively) large
eg high \(p\)-value
A1: may infer no association
B1: allow
eg \(r_s\) close to \(-1\)
eg \(r_s\) is closer to –1 than 0;
eg \(r_s\) is not small
B0 for eg \(r_s\) is large oe
M1: allow eg \(p\)-value \(\lt\) 0.05 (or 0.01 or 0.10)
allow eg \(p\)-value is (very) small/low
A1: may infer negative association