
June 2018 Paper 2 Q11
11 Christa used Pearson’s product-moment correlation coefficient, \(r\), to compare the use of public transport with the use of private vehicles for travel to work in the UK.
| Number of employees using public transport | \(x\) |
| Number of employees using private vehicles | \(y\) |
| Proportion of employees using public transport | \(a\) |
| Proportion of employees using private vehicles | \(b\) |
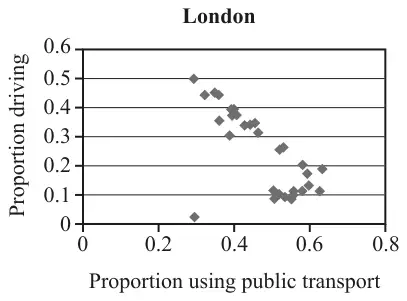
One London Borough is represented by an outlier in the diagram.
Explain your answer. [1]
| Scheme | Marks | AO |
|---|---|---|
| Both the number of employees using public transport and the number of employees using private vehicles depend on the LA population. | E1 | 2.1 |
| [1] |
Notes
E1: or similar, but must be in context.
Ignore all else
NOT No. using pt is prop to no. using pv
| Scheme | Marks | AO |
|---|---|---|
| Negative | E1ind | 2.2b |
| If a large prop use public transport then a smaller prop drive (and vice versa) | E1ind | 2.4 |
| [2] |
Notes
E1ind: Ignore "strong" or "slight" etc
E1ind: or similar in context
NOT Inverse prop'n
NOT "as \(a\) increases \(b\) decreases" unless in context
| Scheme | Marks | AO |
|---|---|---|
| Decrease the size of \(r\) or Make \(r\) less negative | E1 | 2.2b |
| [1] |
Notes
E1: Make (value of) \(r\) increase
\(r\) closer to 0
Ignore eg "greatly"
Ignore all else
NOT Make \(r\) decrease
NOT Weaken the corr'n
NOT Make corr'n less
| Scheme | Marks | AO |
|---|---|---|
| Little effect (because the population of the LA is small compared with the whole population) | E1 | 2.2b |
| [1] |
Notes
E1: or No effect or similar
Ignore all else
| Scheme | Marks | AO |
|---|---|---|
| Ignore all reference to public transport Type 1 answers People don't travel far to work Jobs are close High proportion walk (or cycle) | E1 | 2.4 |
| [1] |
Notes
Type 2 answers
Any suggested reason why few drive
eg Few garages; Parking expensive
or similar in context
NOT just Few drive