
C1 June 2012 Q10
10.
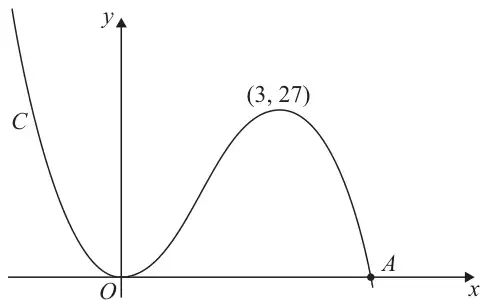
Figure 1 shows a sketch of the curve \(C\) with equation \(y = \mathrm{f}(x)\) where\[\mathrm{f}(x) = x^2(9 - 2x)\]There is a minimum at the origin, a maximum at the point \((3, 27)\) and \(C\) cuts the \(x\)-axis at the point \(A\).
On each sketch you should indicate clearly the coordinates of the maximum point and any points where the curves cross or meet the coordinate axes.
(6)The curve with equation \(y = \mathrm{f}(x) + k\), where \(k\) is a constant, has a maximum point at \((3, 10)\).
| Scheme | Marks |
|---|---|
| {Coordinates of \(A\) are} \((4.5, 0)\) See notes below | B1 |
| (1) |
Notes
B1: For stating either \(x = 4.5\) or \(\tfrac{9}{2}\) or \(\tfrac{18}{4}\) etc. or \(A = 4.5\) or \(\tfrac{9}{2}\) or \((4.5, 0)\). Can be written on graph.
Allow \((0, 4.5)\) marked on curve for B1. Otherwise \((0, 4.5)\) without reference to any of the above is B0.
(i)
| Scheme | Marks |
|---|---|
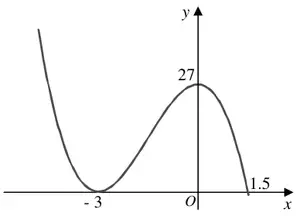
| Horizontal translation | M1 |
| -3 and their ft 1.5 on postive \(x\)-axis | A1 ft |
| Maximum at 27 marked on the \(y\)-axis | B1 |
| (3) |
(ii)
| Scheme | Marks |
|---|---|
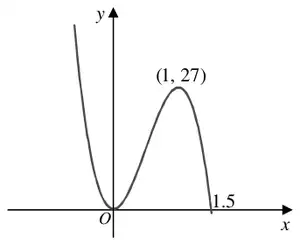
| Correct shape, minimum at \((0, 0)\) and a maximum within the first quadrant. | M1 |
| 1.5 on \(x\)-axis | A1 ft |
| Maximum at \((1, 27)\) | B1 |
| (3) |
Notes
(b)(i)M1: for any horizontal (left-right) translation where minimum is still on \(x\)-axis not at \((0, 0)\).
Ignore any values.
A1ft: for -3 (NOT 3) and 1.5 (or their \(x\) in part (a) – 3) evaluated and marked on the positive \(x\)-axis.
Allow \((0, -3)\) and/or \((0, \text{ft } 1.5)\) rather than \((-3, 0)\) and (ft 1.5, 0) if marked in the “correct” place on the \(x\)-axis. Note: Candidate cannot gain this mark if their \(x\) in part (a) is less than 3.
B1: Maximum at 27 marked on the \(y\)-axis. Note: the maximum must be on the \(y\)-axis for this mark.
(ii)M1: for correct shape with minimum still at \((0, 0)\) and a maximum within the first quadrant. Ignore values.
A1ft: for \(\dfrac{\text{their } x \text{ in part } (a)}{3}\); as intercept on \(x\)-axis eg: \(\dfrac{4.5}{3}\) or 1.5 or \(\dfrac{3}{2}\) or \(\dfrac{9}{6}\) Note: a generalised \(\dfrac{A}{3}\) is A0.
Allow \((0, \text{ft } 1.5)\) rather than (ft 1.5, 0) if marked in the “correct” place on the \(x\)-axis.
B1: Maximum at \((1, 27)\) or allow 1 marked on the \(x\)-axis and the corresponding 27 marked on the \(y\)-axis.
Note: Be careful to look at the correct graph. The candidate may draw another graph to help them to answer part (c).Note: You can recover (b)(i) \((-3, 0)\) and (ft 1.5, 0) or in (b)(ii) (ft 1.5, 0) as correct coordinates only in candidate’s working if these are not marked on their sketch(es).
| Scheme | Marks |
|---|---|
| \(\{k =\}\ -17\) | B1 |
| (1) | |
| (8 marks) |
Notes
B1: for \((k =)\ -17\) only. BEWARE: This could be written in the middle or at the bottom of a page.