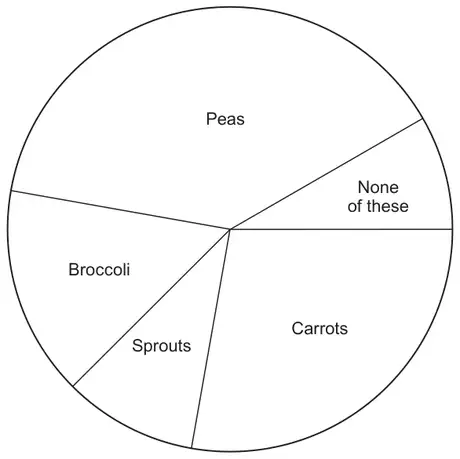
(a) 1080 people were asked to choose their favourite vegetable. The pie chart shows the results.
(i) How many people chose broccoli as their favourite vegetable? You must show all your working. [3]
(ii) How many more people chose carrots than chose sprouts as their favourite vegetable? You must show all your working. [3]
(b)
420 people selected peas as their favourite vegetable. They were asked which they preferred: fresh peas, frozen peas or tinned peas.
Of these 420 people, \(\dfrac{3}{14}\) said they preferred fresh peas.
Twice as many people preferred frozen peas to tinned peas.
How many of these people preferred frozen peas? [4]
Mark scheme (a)
Scheme
Marks
Comments
(i) Angle 55° (±2°) or 15.277...(%) (±0.55...%)
B1
Sight of 55 ignoring any incorrect units is B1 only, until used in a relevant calculation
1080 × 55 (±4) ÷ 360 or 3 × 55 (±4) or 1080 × 15.277... (±1.11..)
M1
FT for M1 only if the angle is out of tolerance but within ±4° or equivalent working with percentage ±1.11...%
165 (people)
A1
Ignore incorrect units given OR a whole number in the inclusive range 159 to 171 (people) only as FT from working with 55° ± 2° or 15.277..% ±0.55..% Do not FT beyond tolerance of ± 2° or ±0.55..%
Check diagram for angles or percentages
(ii) Carrots 100° ±2° and Sprouts 35° ±2° or 27.77..% ±0.55% and 9.722..% ±0.55% or appropriate sight of 65° (±4)
B1
Both angles within tolerance
1080 × 100 (±2) ÷ 360 - 1080 × 35 (±2) ÷ 360, or 1080 × 65 (±4) ÷ 360 or 3 × 65 (±4) or 3 ×100 (±2) – 3 × 35 (±2) or \(\dfrac{100\ (\pm 2) - 35\ (\pm 2)}{360}\) ×1080 or equivalent
M1
FT 65 (±4) × ‘their number of people per degree’ FT for M1 only if one angle is out of tolerance but this one angle is within ±4° or equivalent working with percentage ±1.11...%
195 (people)
A1
OR a whole number in the inclusive range 183 to 207 (people) only as FT tolerance in angles or percentages
We'd like to use Google Analytics cookies to count visits and see which pages help most. They're optional, and the site works exactly the same either way. Privacy policy