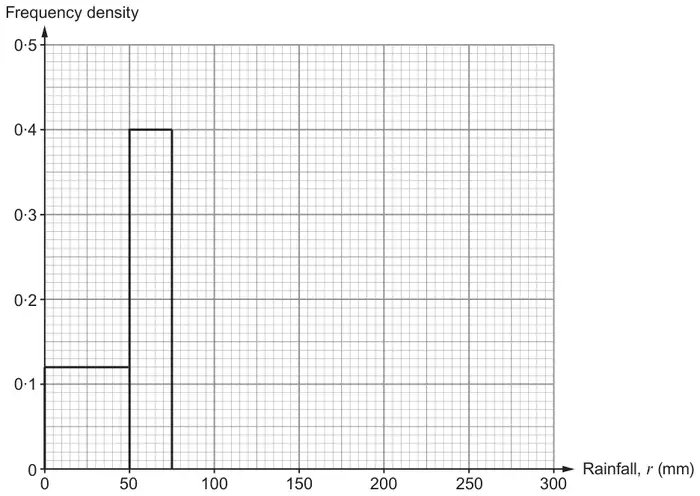
FT for a numerator /’their 6+10+10+7+12+8+7’ where 44 < numerator < 54 for B0M1A0
If their denominator ≠ 60, then 6+10+10+7+12+8+7 or 5×12 must be seen leading to their incorrect denominator
If their fraction is for the number of months where there was less than 60mm rainfall, FT for a numerator /’their 6+10+10+7+12+8+7’ where 6 < numerator < 16 for B0M1A0 provided an attempt is subsequently made to subtract this from 100%
We'd like to use Google Analytics cookies to count visits and see which pages help most. They're optional, and the site works exactly the same either way. Privacy policy