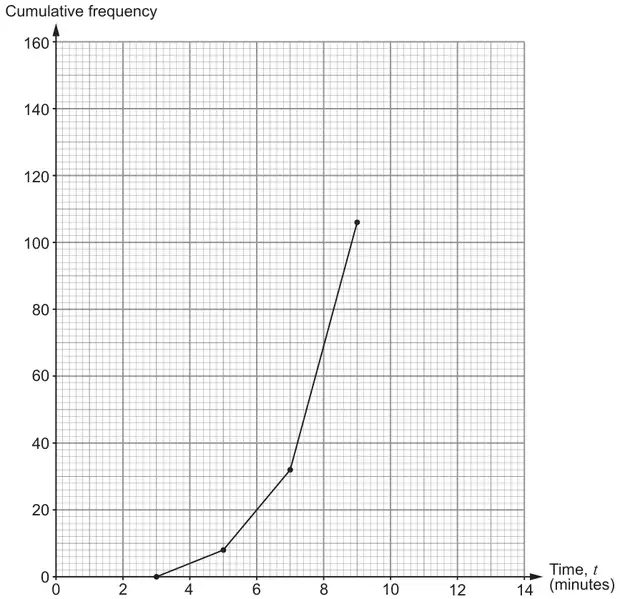
9. Giovanni has a takeaway pizza van. He sells whole pizzas and slices of pizza from his van.
(a) For the last 3 days, he has timed how long it takes to complete the food order for each of his customers. Giovanni recorded his results in the table below.
(i) Complete the cumulative frequency table and the cumulative frequency diagram. [2]
Time, t (minutes)
Frequency
Cumulative frequency
\(3 \lt t \leqslant 5\)
8
8
\(5 \lt t \leqslant 7\)
24
32
\(7 \lt t \leqslant 9\)
74
106
\(9 \lt t \leqslant 11\)
40
……………
\(11 \lt t \leqslant 13\)
14
……………
Use your cumulative frequency diagram to give the best estimates for the answers to each of the following questions.
(ii) Find the median time taken to complete a food order. [1]
The median time is …………… minutes.
(iii) Giovanni is concerned that food orders are taking too long to complete. He says,
“Only 25% of the food orders are completed in under …………… minutes.”
Use one of the five values below to complete Giovanni’s statement. [1]
6·4 6·6 7·2 8 9·6
(iv) Calculate the percentage of orders that were completed in less than 6 minutes. [2]
(b) For the last 3 days:
Giovanni spent £180 on ingredients
he spent £220 on the running costs for the pizza van
he received a total of £700 from the food orders.
Calculate Giovanni’s percentage profit. [3]
(c) Next year Giovanni intends to charge £8.40 for a basic pizza. This is an increase of 20% from the current charge.
Calculate how much Giovanni currently charges for a basic pizza. [2]
Mark scheme (a)
Scheme
Marks
Comments
(i) Entries 146 and 160 in the table and the cumulative frequency diagram completed correctly (correct plots (11, 146) and (13, 160) and all plots joined)
B2
B1 for any one of the following:
146 and 160 in the table, correct plots but not joined
146 and 160 in the table, with one correct plot and one incorrect plot in completing the cumulative frequency diagram with plots joined
one error in the table, including FT ‘their 146’ + 14 and these cumulative entries used correctly to complete the cumulative frequency diagram with plots joined
correct cumulative frequency diagram with plots joined, with incorrect, incomplete or not attempted entries in the table
(ii) 8.2 to 8.4 (minutes)
B1
Answer space takes precedence Allow 8 minutes 12 seconds to 8 minutes 24 seconds
FT reading from the graph for ‘their median’, from ½ × ‘their 160’, provided ‘their 160’ ≥ 110, with a tolerance of ½ small square from ‘their cumulative frequency graph’, provided it is possible to read ‘their median’ from the vertical axis on the graph paper provided
(iii) 7.2 minutes
B1
Answer space in the statement takes precedence, if blank award for indication of ‘7.2’ (circled) in the list
Allow ‘7’ in the answer space provided 7.2 indicated in the list Do not accept ‘8’ in the answer space if 7.2 indicated in the list
(iv) \(\frac{20}{160}\) ( × 100) or \(\frac{1}{2}\) × 25 (%) or equivalent
M1
FT for (100 ×) 20/‘their 160’, provided ‘their 160’> 106
12.5 (%) or 12½ (%)
A1
On FT allow rounding or truncation to 1 decimal place
Mark scheme (b)
Scheme
Marks
Comments
(Costs are 180 + 220) (£) 400 AND (Profit is 700 – 180 – 220) (£) 300 OR (Receipts / Costs =) \(\frac{700}{400}\) (× 100)
We'd like to use Google Analytics cookies to count visits and see which pages help most. They're optional, and the site works exactly the same either way. Privacy policy