
Numeracy Intermediate November 2021 Unit 1 Q10
10. Bethan works as an office manager at a medical centre.
Last Monday, 60 patients each had an appointment with a doctor.
Bethan recorded how long each patient’s appointment lasted.
Her results are given in the table below.
| Length of time, \(t\) (minutes) | \(0 < t \leqslant 4\) | \(4 < t \leqslant 8\) | \(8 < t \leqslant 12\) | \(12 < t \leqslant 16\) | \(16 < t \leqslant 20\) | \(20 < t \leqslant 24\) |
|---|---|---|---|---|---|---|
| Number of patients | 4 | 24 | 18 | 6 | 2 | 6 |
(a) Complete the following cumulative frequency table. [1]
| Time, \(t\) (minutes) | \(t \leqslant 0\) | \(t \leqslant 4\) | \(t \leqslant 8\) | \(t \leqslant 12\) | \(t \leqslant 16\) | \(t \leqslant 20\) | \(t \leqslant 24\) |
|---|---|---|---|---|---|---|---|
| Cumulative frequency | 0 | 4 | 28 | 60 |
(b) On the graph paper below, draw a cumulative frequency diagram to show this information. [2]
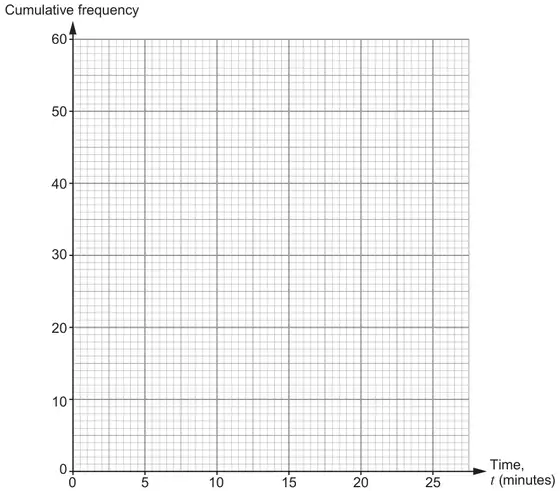
(c) Each patient is given 10 minutes for their appointment.
Use your graph to give the best estimate for the number of appointments that lasted longer than 10 minutes.
Give your answer correct to the nearest whole number of appointments. [2]
Use your graph to give the best estimate for the number of appointments that lasted longer than 10 minutes.
Give your answer correct to the nearest whole number of appointments. [2]
(d) Of the patients seen last Monday, what percentage spent longer than 20 minutes with the doctor? [2]
(e) The median length of the appointments last Tuesday was 11·5 minutes.
How much shorter was the median length of the appointments on Monday?
Give your answer correct to the nearest minute. [2]
How much shorter was the median length of the appointments on Monday?
Give your answer correct to the nearest minute. [2]
(f) Bethan is considering changing the time given for each patient’s appointment to 12 minutes.
She would set a target of 80% of patient appointments taking less than or equal to 12 minutes.
Would this target have been met last Monday?
You must show all your working. [3]
She would set a target of 80% of patient appointments taking less than or equal to 12 minutes.
Would this target have been met last Monday?
You must show all your working. [3]
| Scheme | Marks | Comments | ||||||
|---|---|---|---|---|---|---|---|---|
| B1 |
| Scheme | Marks | Comments |
|---|---|---|
| Correct cumulative frequency diagram drawn, with points joined with a straight line or a curve | B2 | FT only cumulative entries from (a) B1 for either
|
| Scheme | Marks | Comments |
|---|---|---|
| 23 (patient appointments) | B2 | STRICT FT ‘their cumulative graph’, i.e. correctly evaluated ‘60 – their 37’ B1 for sight of 60 – ‘their 37’ If ‘their graph’ is not cumulative or shows bars, FT for ‘60 – their 37’ provided a unique reading for 10 minutes (60 – ‘their reading at 10 minutes) but award B1 only (not B2) If no marks, award SC1 for 23 (patient appointments) calculated or unsupported, when not from ‘cumulative frequency graph’, e.g. (18/2 + 6 + 2 + 6 =) 23 |
| Scheme | Marks | Comments |
|---|---|---|
| \(\dfrac{6}{60}\) ( × 100) or (100 ×) 1 - \(\dfrac{54}{60}\) ( × 100) | M1 | FT ‘their 54’ (reading for t ≤ 20) provided > 28 |
| 10 (%) | A1 | Do not accept an answer with incorrect units, e.g. ‘10 people’ |
| Scheme | Marks | Comments |
|---|---|---|
| Difference in medians 3 (minutes) | B2 | Allow if calculated from the information in the table Must be correct to the nearest minute for ‘their cumulative frequency graph’ FT ‘their cumulative frequency graph’ Do not accept an answer from incorrect working, including without a cumulative graph seen B1 for either
On FT, if ‘their answer’ ≠ whole number of minutes, it must be rounded to the nearest minute |
| Scheme | Marks | Comments |
|---|---|---|
Sight of any one of:
| M1 | FT ‘their 46’ from an incorrect cumulative total in (a) (i.e. ‘their value in the table for t ≤ 12’) |
| Conclusion, ‘no (target not met)’ AND a correct evaluation:
| A2 | FT for correctly evaluated use of ‘their 46’ Allow for sight of 46 ÷ 60 = 0.76(…) or 100 × 46 ÷ 60 = 76(%) Allow, e.g. ‘over 0.7’ or ‘over 70(%) only provided the correct conclusion ‘no’ is given If 48 is not evaluated, accept the time from ‘their graph’ for 48 appointments instead A1 for a correct evaluation:
|