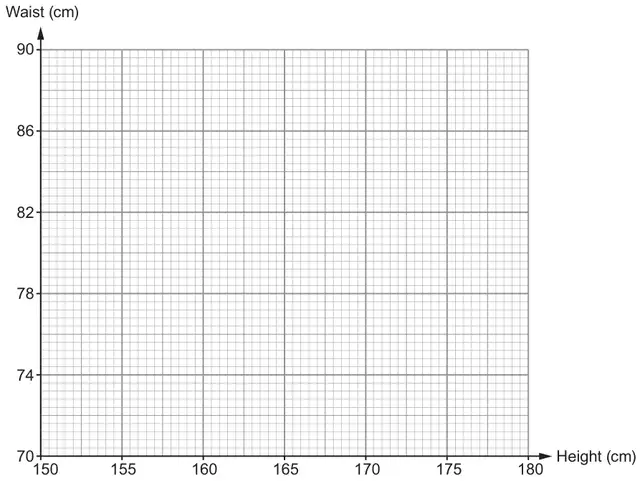
5. Ffion thinks that the taller you are, the greater your waist measurement will be. She recorded the height and waist measurements, in centimetres, for 6 people.
Height (cm)
170
152
174
155
178
162
Waist (cm)
82
72
86
74
90
78
(a) Draw a scatter diagram to display these measurements. Use the graph paper below. [2]
(b) Look at the results that Ffion has recorded for these 6 people. Do they appear to support her thinking? Give a reason for your answer. [1]
Yes ☐ No ☐ Can’t tell ☐
(c) Give one reason why using this scatter graph to estimate the waist measurement of other people is unlikely to give reliable results. [1]
Mark scheme (a)
Scheme
Marks
Comments
All 6 plots correct
B2
B1 for
any 3, 4 or 5 correct plots not joined point to point, or
all 6 correct plots but joined point to point
Ignore sight of any attempt at a line of best fit
Mark scheme (b)
Scheme
Marks
Comments
YES and a reason, e.g. 'positive correlation', ‘increase in height with increase in waist’, ‘the height and waist are increasing’
E1
Do not accept reference using values from the table, without further explanation
Mark scheme (c)
Scheme
Marks
Comments
Reason, e.g. ‘the measurements for these 6 people show correlation, but people don’t come in standard sizes’, ‘it is only 6 people’, 'not all people follow the trend', ‘waist and height measurements are not directly proportional’, ‘not enough data’, ‘you really need more data to tell’, ‘because she could have chosen the people on purpose to prove her point’, ‘because some people are thinner than others but the same height’, ‘some waists might be the same as others’
E1
Ignore additional comments referring to improvement
Allow, e.g. ‘Ffion has not considered children’, ‘because waist sizes often vary’, ‘because not everybody is the same’, ‘they are not always in a straight line’
Do not accept, e.g. ‘could be measured incorrectly’, ‘could repeat the experiment’, ‘measure more people’, ‘get more data’ (implies how to improve, not a comment on the data given) Do not accept reasons based on how to improve the experiment alone
We'd like to use Google Analytics cookies to count visits and see which pages help most. They're optional, and the site works exactly the same either way. Privacy policy