
Numeracy Higher November 2020 Unit 1 Q10
10. The management of a hospital wants to reduce the waiting time in its Accident and Emergency Unit.
After arriving at the unit, patients have to wait to see a doctor.
One Tuesday, the waiting time for each patient was recorded.
The results are displayed in the following histogram.
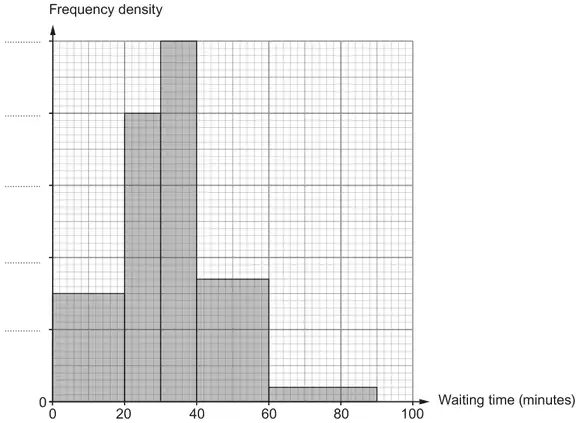
(a) 15 patients had to wait up to 20 minutes.
Complete the scale on the frequency density axis. [2]
Complete the scale on the frequency density axis. [2]
(b) Show that there were 80 patients in total who waited to see a doctor on this Tuesday. [2]
(c) Calculate an estimate of the inter-quartile range of the waiting times recorded.
You must show all your working. [5]
You must show all your working. [5]
Estimate of the inter-quartile range = …………………… minutes
(d) One Saturday, the waiting time for each patient was recorded.
The inter-quartile range of the waiting times for this Saturday was smaller than the inter-quartile range for the Tuesday.
The inter-quartile range of the waiting times for this Saturday was smaller than the inter-quartile range for the Tuesday.
The management used this fact to conclude that waiting times were shorter on Saturdays than on Tuesdays.
Was the management correct to come to this conclusion?
Yes ☐ No ☐
Explain your answer. [1]
| Scheme | Marks | Comments |
|---|---|---|
| Uniform scale using intervals of 0.5 | B2 | B1 for sight of 15 ÷ 20 OR B1 for a correct first entry on their scale e.g. 0.5 on the first graduation OR B1 for blank scale in (a) but evidence of the correct scale used in (b) Note: a correct value with none incorrect can be awarded B2 |
| Scheme | Marks | Comments |
|---|---|---|
| (15 +) 10×2 + 10×2.5 + 20×0.85 + 30×0.1 | M1 | FT their uniform scale for a possible M1 only Working may be seen on the graph, including the use of every 2cm2 represents 5 people Allow M1 for the sum of all 5 products with any 2 correct (not including 15) |
| 15 + 20 + 25 + 17 + 3 (= 80) | A1 | CAO If no marks awarded, award SC1 for sight of (15), 20, 25, 17, 3 |
| Scheme | Marks | Comments |
|---|---|---|
| (Upper quartile = time for 75th percentile =) 40 (min) | B1 | Working may be seen on the graph |
| (Lower quartile = time for 25th percentile) 2x = 5 or (20 +) ¼ × 10 | M1 | Or \(\dfrac{5}{20}\) × 10 |
| x = 2.5 or 5/2 or (20 + ) 2.5 or 5/2 | A1 | |
| (Lower quartile =) 22.5 (minutes) | A1 | Note: 90÷4 = 22.5 is M0A0A0 An unsupported lower quartile of 22.5 with an upper quartile of 67.5 is awarded B0M0A0A0 |
| (Estimate of IQR =) 17.5 (minutes) | B1 | FT ‘their 40’ – ‘their 22.5’ correctly evaluated provided at least 1 mark previously awarded |
| Scheme | Marks | Comments |
|---|---|---|
| ‘No’ AND a correct explanation e.g. ‘The smaller inter-quartile range on Saturday implies the waiting times are more closely grouped (or less dispersed) then on Tuesday, but tells us nothing about the length of the waiting times on these two days’, or ‘Inter-quartile range is not an average’, or ‘Inter-quartile range only gives a measure of the spread of the data’, or ‘The difference in the medians would tell us if the waiting times were quicker’ | E1 | If neither box has been ticked, accept ‘No’ being clearly implied in their explanation Do not accept e.g. ‘Not enough data’, or ‘Only one Saturday and one Tuesday have been recorded’ |