
Numeracy Higher November 2019 Unit 1 Q6
6. On 1st July every year, Trefor estate agents record the time from when a phone rings to when it is answered.
The time taken to answer the phone is recorded in seconds.
Trefor displays the data for their agents to see.
The displays for 1st July 2018 and 1st July 2019 are shown below.
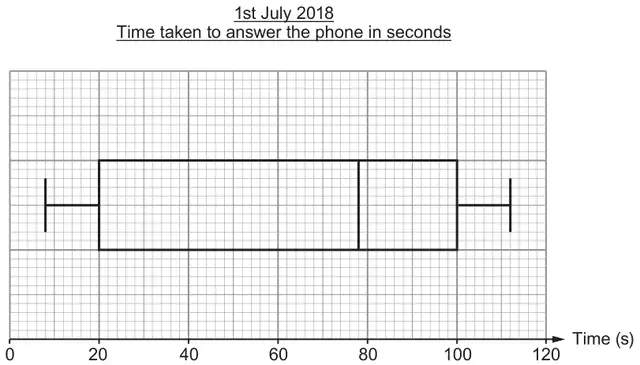
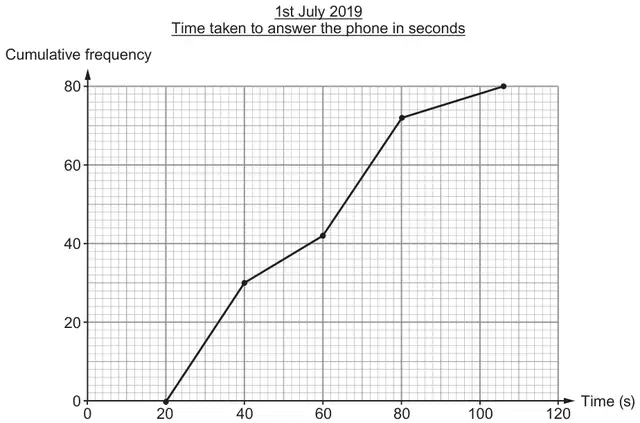
Use the diagrams above to answer the following questions.
(a) What is the range of times taken to answer the phone for 1st July 2018?
Circle your answer. [1]
Circle your answer. [1]
101 seconds 80 seconds 78 seconds 106 seconds 104 seconds
(b) What is the maximum possible range of times taken to answer the phone for 1st July 2019?
Circle your answer. [1]
Circle your answer. [1]
86 seconds 106 seconds 80 seconds 56 seconds 83 seconds
(c)
The manager of Trefor estate agents claims that there has been an improvement in the median time taken to answer the phone from 1st July 2018 to 1st July 2019.
Is this true?
Yes ☐ No ☐
You must show all your working. [2]
(d) Complete the following statements.
(i) ‘On 1st July 2018, 75% of the phone calls were answered within …………… seconds.’ [1]
(ii) ‘On 1st July 2019, 75% of the phone calls were answered within …………… seconds.’ [2]
| Scheme | Marks | Comments |
|---|---|---|
104 seconds | B1 |
| Scheme | Marks | Comments |
|---|---|---|
| 86 seconds | B1 |
| Scheme | Marks | Comments |
|---|---|---|
| Sight of median 1st July 2018 78 (seconds) AND Sight of median 1st July 2019 56 or 57 (seconds) AND States or implies ‘Yes’ | B2 | Check the diagrams Allow statements without giving medians, e.g. ‘medians are (just) less than 80 and less than 60 respectively’ If medians are stated they must be correct, otherwise possible maximum of B1 B1 for
|
| Scheme | Marks | Comments |
|---|---|---|
| (i) 100 (seconds) | B1 | |
| (ii) (0.75 × 80 =) 60 (calls) | M1 | |
72 (seconds) | A1 | 60 seen in the answer space is awarded M1 A0 If no marks, award SC1 for a misread of the graph implied from sight of answers 66, 76 or an answer between 71 and 73 (excluding 72) |