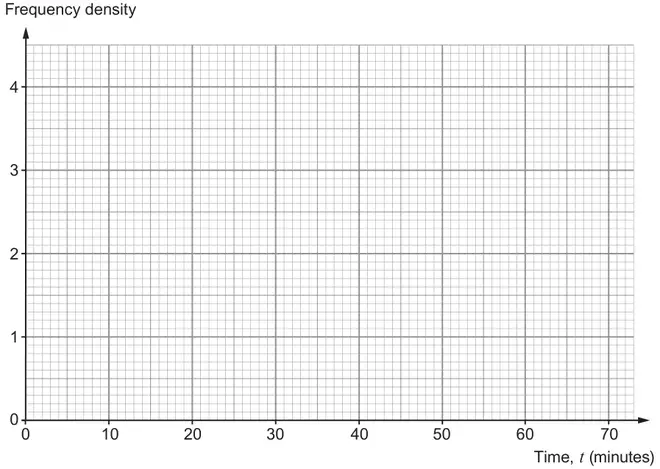
7. The headteacher of Ynysgorwen School wants to know how long it takes pupils to travel to school. The results for a sample of 120 pupils are shown in the table below.
Time taken, \(t\) (minutes)
Frequency
Frequency density
\(0 \lt t \leqslant 10\)
34
3·4
\(10 \lt t \leqslant 20\)
40
……………
\(20 \lt t \leqslant 35\)
24
……………
\(35 \lt t \leqslant 50\)
18
……………
\(50 \lt t \leqslant 70\)
4
……………
(a)
(i) Complete the frequency density column. [3]
(ii) Draw a histogram to display this data. [2]
(b)
(i) Calculate an estimate of the median travel time for the sample of pupils. [4]
(ii) What is the greatest possible median travel time for the sample of pupils? [1]
Mark scheme (a)
(i)
Scheme
Marks
Comments
Correct method to calculate a frequency density for any 2 groups
M1
Frequency densities of 4, 1.6, 1.2, 0.2
A2
A1 for any 2 correct frequency densities
(ii)
Scheme
Marks
Comments
Fully correct histogram drawn
B2
FT their frequency densities throughout provided they fit on the given scale B1 for at least 3 correct bars drawn
Mark scheme (b)
(i)
Scheme
Marks
Comments
Working from the left of the graph \(\dfrac{120}{2}\) – 34 or equivalent OR (from the right) 4 + 18 + 24 + 40 – \(\dfrac{120}{2}\) or equivalent
M1
Allow use of \(\dfrac{120+1}{2}\) for \(\dfrac{120}{2}\) for M1A0, but final m1A1 still available
= 26 (pupils needed from the 10-20 group)
A1
CAO
(Median =) (10 +) \(\dfrac{26}{40}\) ×10 or equivalent
m1
FT ‘their 26’
= 16.5 (mins)
A1
Or 16 minutes 30 seconds
Alternative method (b)(i)
Scheme
Marks
Comments
Working from the right of the graph \(\dfrac{120}{2}\) – 4 – 18 – 24 or equivalent OR (from the left) 34 + 40 – \(\dfrac{120}{2}\)
M1
Allow use of \(\dfrac{120+1}{2}\) for \(\dfrac{120}{2}\) for M1A0, but final m1A1 still available
= 14 (people needed from the 10-20 group)
A1
CAO
(Median =) (20 –) \(\dfrac{14}{40}\) ×10 or equivalent
m1
FT ‘their 14’
= 16.5 (mins)
A1
Or 16 minutes 30 seconds
(ii)
Scheme
Marks
Comments
20 (minutes)
B1
FT the upper limit of the group their median is in from (b)(i)
We'd like to use Google Analytics cookies to count visits and see which pages help most. They're optional, and the site works exactly the same either way. Privacy policy