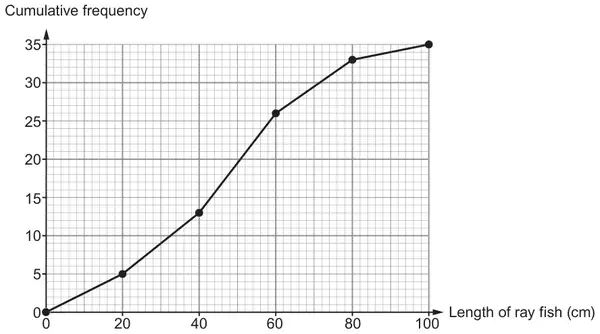
(a) An aquarium has 35 ray fish. The cumulative frequency graph shows information about the lengths of these ray fish.
Use the cumulative frequency diagram to give the best estimates for the answers to the following questions.
(i) What is the median length of these ray fish? [1]
…………………… cm
(ii) How many of these ray fish have lengths greater than 72 cm? [1]
(b) The aquarium also has guppies. The table shows information about the length of the guppies in a sample of 60 guppies.
Minimum
Range
Median
Lower quartile
Interquartile range
1·6 cm
5·2 cm
3·2 cm
2·4 cm
3·4 cm
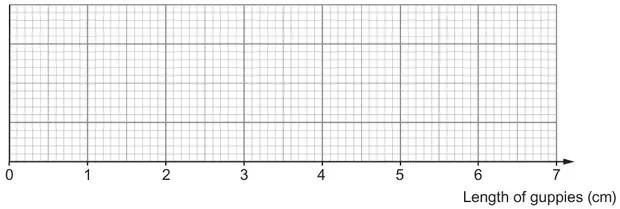
(i) Draw a box-and-whisker plot of this data on the grid below. [4]
(ii) How many of the sample of 60 guppies have a length greater than or equal to 2·4 cm? [2]
(c) A carp was weighed in November 2021. It was weighed again in April 2022. The carp had a mass of 9·9 kg in April 2022. Between these dates, the mass of the carp increased by 10%.
Calculate the mass of the carp in November 2021. [2]
Mark scheme (a)
(i)
Scheme
Marks
Comments
Answer in the range 46 to 48 (cm)
B1
(ii)
Scheme
Marks
Comments
5 (ray fish)
B1
Mark scheme (b)
(i)
Scheme
Marks
Comments
Correct format of a box-and-whisker with at least one of minimum, LQ, median, UQ or maximum correct
B1
Do not ignore additional lines drawn Do not accept minimum of 0cm or maximum of 7cm End vertical stopper lines omitted can be ignored
Showing:
Minimum
LQ
Median
1.6 (cm)
2.4 (cm)
3.2 (cm)
B1
Must all be shown on the diagram/graph Do not accept plotted points for LQ and median, must be intention to draw lines Must be intention of the minimum, LQ and median, for the median ignore 1 spurious line also drawn
UQ at 5.8 (cm)
B1
Must be shown on the diagram/graph
Maximum at 6.8 (cm)
B1
Must be shown on the diagram/graph If no marks for both UQ and maximum, allow SC1 for sight of UQ as 5.8 (cm) or maximum 6.8 (cm) in working
(ii)
Scheme
Marks
Comments
0.75 × 60 or equivalent
M1
45 (guppies)
A1
If no marks, award SC1 for an answer of 15 (guppies) or for sight of 75% or ¾
Mark scheme (c)
Scheme
Marks
Comments
100 × 9.9 ÷ (100 + 10) or 9.9 ÷ 1.1 or equivalent
M1
Allow 9.9 – 0.9 provided 0.9 is not from incorrect working
We'd like to use Google Analytics cookies to count visits and see which pages help most. They're optional, and the site works exactly the same either way. Privacy policy