
Numeracy Foundation June 2023 Unit 1 Q10
10. The scatter diagram shows the length and width of some television remote handsets.
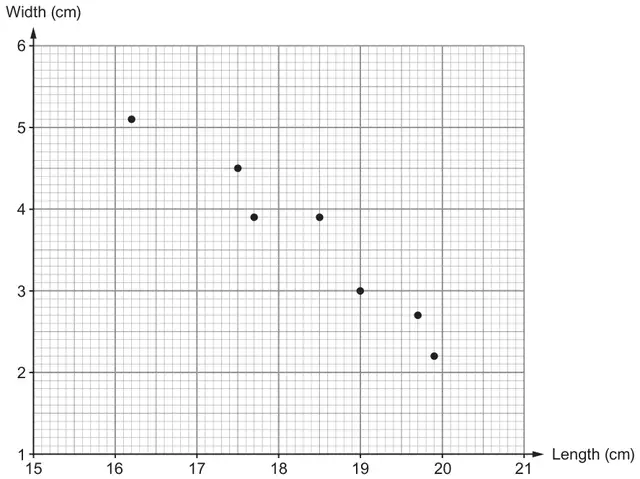
(a) Two of the remotes have the same width.
Write down the width and lengths of these remotes. [2]
Write down the width and lengths of these remotes. [2]
Width …………… cm
Lengths are …………… cm and …………… cm.
(b) How is it best to describe the correlation seen in this scatter diagram? [1]
(c) Draw a line of best fit on the scatter diagram. [1]
| Scheme | Marks | Comments |
|---|---|---|
| Width 3.9 cm AND Lengths 17.7 cm and 18.5 cm | B2 | Accept lengths given in either order, 17.7 cm and 18.5 cm or 18.5 cm and 17.7 cm B1 for any 2 correct measurements |
| Scheme | Marks | Comments |
|---|---|---|
| (Strong) negative (correlation) | B1 | CAO |
| Scheme | Marks | Comments |
|---|---|---|
| Suitable line of best fit drawn | B1 | The straight line (accept intention if a ruler is not used) must have points above and below it, generally this is 3 above and 4 below The line must be of sufficient length, to illustrate trend for at least 5 points The trend shows that there are points above and below the line at each end of the line Allow, e.g. the line of best fit following the ‘trend’
|