
Foundation June 2023 Paper 2 Q13
13. Ken measured the resting heart rate, in beats per minute (bpm), of twelve people.
He asked them how many hours of exercise they usually completed each week.
The results for seven of the people have been plotted on the scatter diagram.
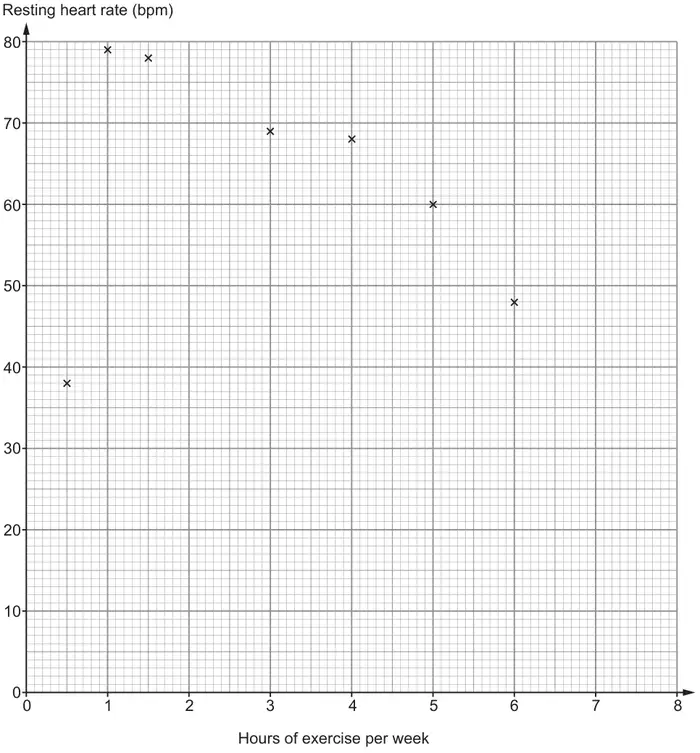
(a)
Here are the results for the remaining five people.
| Hours of exercise per week | 2 | 4 | 1 | 7 | 5·5 |
|---|---|---|---|---|---|
| Resting heart rate (bpm) | 70 | 58 | 60 | 55 | 57 |
Plot these results on the scatter diagram. [2]
(b)
Ken recorded one person’s resting heart rate incorrectly.
Circle the point on the scatter diagram that this is most likely to be. [1]
(c) Describe the relationship between hours of exercise per week and resting heart rate of the people Ken asked.
Ignore the result that was recorded incorrectly. [1]
Ignore the result that was recorded incorrectly. [1]
| Scheme | Marks | Comments |
|---|---|---|
| Correctly plotting all 5 points | B2 | And no extra plots B1 for any 3 or 4 points plotted correctly and not more than 5 points plotted in total or for 5 points plotted correctly with at most 1 extra incorrect plot |
| Scheme | Marks | Comments |
|---|---|---|
| Point (0.5,38) indicated | B1 |
| Scheme | Marks | Comments |
|---|---|---|
| A valid comment e.g. ‘The more hours of exercise someone does, the lower their resting heart rate’. ‘The less exercise someone does, the higher their resting heart rate’. ‘There is a negative correlation’. | B1 | Do not allow e.g. ‘It is negative’. ‘The heart rate is lower when you exercise’. ‘After each hour of exercise, the resting heart rate drops’. ‘As exercise increases, bpm decreases’ ‘The more exercise someone does, the lower their bpm’. ‘The less exercise someone does, the higher their bpm’. |
| (4) |