
Intermediate November 2020 Unit 1 Q4
4. 300 students were asked if they would like to change their school’s dinner menu.
The pie chart below shows how they answered.
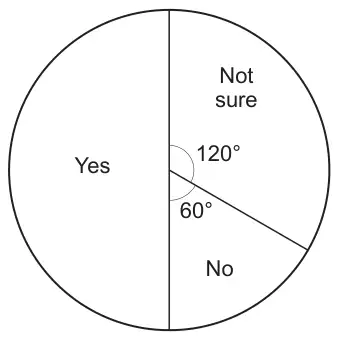
Complete the table below to show the number of students who gave each answer. [3]
| Answer | Yes | No | Not sure |
|---|---|---|---|
| Number of students |
| Scheme | Marks | Comments | ||||||||
|---|---|---|---|---|---|---|---|---|---|---|
| B3 | B1 for (Yes =) 150 C.A.O. B2 for (No =) 50 AND (Not sure =) 100. or FT ‘their Yes’ for (No =) ⅓(300 − ‘Yes’) AND (Not sure =) ⅔(300 – ‘Yes’) If B2 not gained, then B1 for (No =) 50 OR (Not sure =) 100 or FT ‘their Yes’ for (No =) ⅓(300 − ‘Yes’) OR (Not sure =) ⅔(300 – ‘Yes’) or B1 for ‘No’ + ‘Not sure’ = 150 or B1 if ‘Not sure’ = 2 × ‘No’. or B1 for ‘Yes’ + ‘No’ + ‘Not sure’ = 300. |