
Intermediate June 2019 Unit 1 Q11
11. Complete the table below.
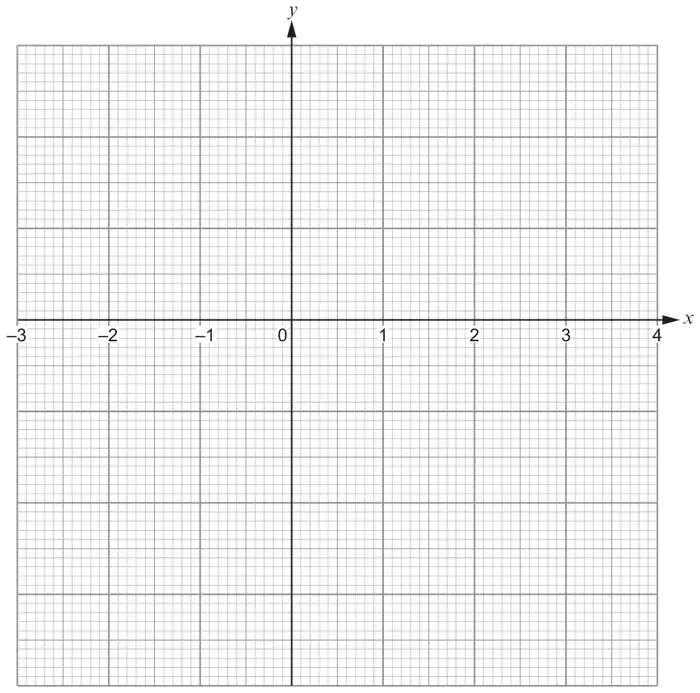
Draw the graph of \(y = 3x^2 - 25\) for values of \(x\) between −3 and 4.
Use the graph paper below.
You must choose a suitable scale for the \(y\)-axis. [4]
| \(x\) | –3 | –2 | –1 | 0 | 1 | 2 | 3 | 4 |
| \(y = 3x^2 - 25\) | 2 | –22 | –25 | –22 | –13 | 2 | 23 |
| Scheme | Marks | Comments |
|---|---|---|
| −13 | B1 | |
| Scale on y-axis ‘2cm square ≡ 10 units’. | B1 | |
| At least 7 correct plots and no incorrect plots. | P1 | F.T. ‘their (−2,−13)’ AND ‘their uniform scale’ if possible. Allow ± ‘½ a small square’. |
| A smooth curve drawn through their plots. | C1 | F.T. ‘their 8 plots’. (Only if an uniform scale used.) OR a curve through the 7 given plots and (-2,-13). Allow intention to pass through their plots (within 1 small square, either horizontally or vertically of the point). |