
Higher November 2020 Unit 1 Q3
3. The table below shows some of the values of \(y = x^2 - 4x - 3\) for values of \(x\) from –2 to 5.
| \(x\) | −2 | –1 | 0 | 1 | 2 | 3 | 4 | 5 |
|---|---|---|---|---|---|---|---|---|
| \(y = x^2 - 4x - 3\) | 2 | −3 | −6 | −6 | −3 | 2 |
(a) Complete the table by finding the value of \(y\) for \(x = -2\) and the value of \(y\) for \(x = 2\). [2]
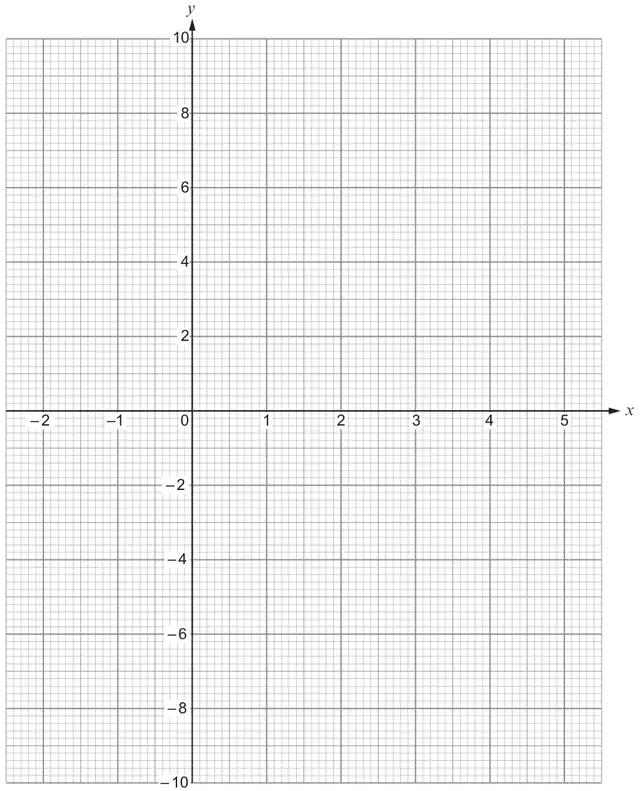
(b) On the graph paper below, draw the graph of \(y = x^2 - 4x - 3\) for values of \(x\) from –2 to 5. [2]
(c) Draw the line \(y = 1\) on the graph paper.
Write down the values of \(x\) where the line \(y = 1\) cuts the curve \(y = x^2 - 4x - 3\). [2]
Write down the values of \(x\) where the line \(y = 1\) cuts the curve \(y = x^2 - 4x - 3\). [2]
Values of \(x\) are …………………… and ……………………
| Scheme | Marks | Comments |
|---|---|---|
| 9 −7 | B2 | B1 for each. |
| Scheme | Marks | Comments |
|---|---|---|
| At least 6 correct plots and no incorrect plot. | P1 | FT ‘their (−2,9)’ and ‘their (2,−7)’ Allow ± ‘½ a small square’. |
| A smooth curve drawn through their plots. | C1 | FT ‘their 8 plots’. OR a curve through the 6 given points and (−2,9) and (2,−7). Allow intention to pass through their plots. (± 1 small square horizontal or vertical.) |
| Scheme | Marks | Comments |
|---|---|---|
| Line \(y = 1\) drawn | B1 | Must be at least 2cm long. |
| −0·8 AND 4·8 | B1 | FT intersection of ‘their curve’ with ‘their \(y = 1\)’ only if exactly two points of intersection and \(y \ne 0\). If curve drawn, but no line drawn, allow a FT from intersection of ‘their curve’ with the line \(y = 1\) only if exactly two points of intersection for B0 B1. Allow ± ‘1 small square’. |