
Higher November 2016 Unit 1 Q15
15.
(a) The diagram shows a sketch of the graph \(y = f(x)\).
The graph passes through the points (–1, 0) and (5, 0) and its highest point is at (2, 7).
The graph passes through the points (–1, 0) and (5, 0) and its highest point is at (2, 7).
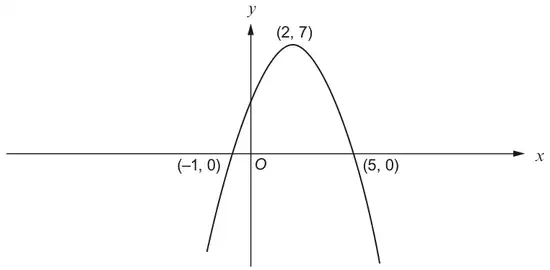
Sketch the graph of \(y = f(x - 3)\) on the axes below.
You must indicate
- the coordinates of the points of intersection of the graph with the \(x\)-axis
- the coordinates of the highest or lowest point. [3]
(b) Using the axes below, sketch the graph of \(y = \cos x + 1\) for values of \(x\) from 0° to 360°. [2]
| Scheme | Marks | Comments |
|---|---|---|
| Concave down curve with | Allow appropriate marking of axes if coordinates not given. | |
| \(y\)-coordinate of maximum = 7 | B1 | |
| \(x\)-coordinate of maximum = 5 | B1 | |
| Points (2,0) AND (8, 0) shown. | B1 |
| Scheme | Marks | Comments |
|---|---|---|
| Cosine curve | M1 | Intention to sketch a portion of a cosine curve with minimum period of 360°. |
| Correct cosine curve with 2 shown on the y-axis and 180° and 360° shown or implied. | A1 |