
Higher June 2017 Unit 1 Q18
18. The graph of \(y = x^2\) has been drawn below, for values of \(x\) from \(x = 0\) to \(x = 6\).
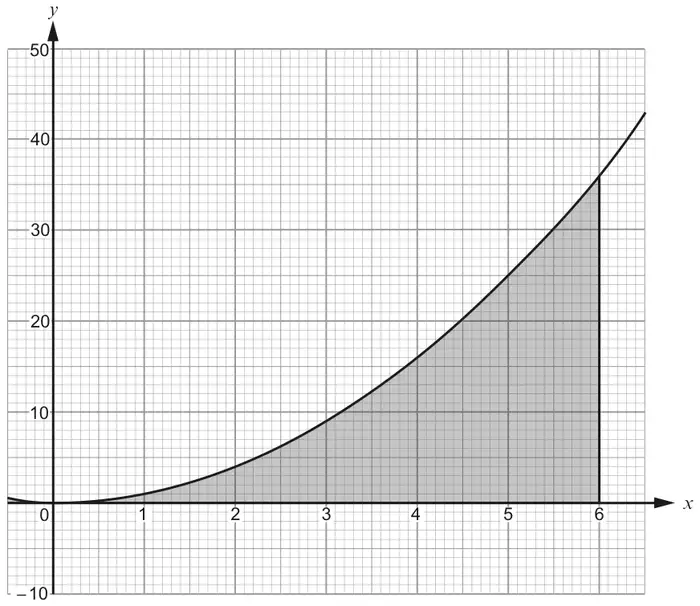
Use the trapezium rule, with the ordinates \(x = 0\), \(x = 1\), \(x = 2\), \(x = 3\), \(x = 4\), \(x = 5\) and \(x = 6\), to estimate the area of the shaded region shown above. [4]
From the formula list: Area of trapezium \(= \dfrac{1}{2}(a+b)h\)
| Scheme | Marks | Comments |
|---|---|---|
| Penalise -1 once only for a consistent misreading of one scale. | ||
| Sight of (0), 1, 4, 9, 16, 25 and 36. | B1 | |
| Split into 6 areas AND attempt to add derived areas | M1 | If using 6 separate areas, at least one area calculation (for a trapezium) should be potentially correct. |
| Correct substitution into trapezium rule. Area = ½ [0 + 36 + 2(1 + 4 + 9 + 16 + 25)] | M1 | 1st M1 may be implied by correct use of formula. Or equivalent (0·5+2·5+6·5+12·5+20·5+30·5) F.T. ‘their values of y’ provided at least 2 correct. Allow 1 slip e.g. in a y-value term, in h, or in an individual area. |
| = 73 | A1 | C.A.O. |