
June 2022 Unit 2 Q4
4. Jessica is studying the relationship between hip girth, \(h\) cm, and thigh girth, \(t\) cm, for American adults who are physically active. She takes a random sample of 11 people from a very large dataset which she has downloaded into a spreadsheet software package. The results are shown below.
| \(h\) (cm) | 98·6 | 112·1 | 97·9 | 110·2 | 89·2 | 111·7 | 87·0 | 94·7 | 100·4 | 104·0 | 88·4 |
|---|---|---|---|---|---|---|---|---|---|---|---|
| \(t\) (cm) | 48·3 | 87·2 | 55·2 | 68·0 | 48·5 | 63·2 | 49·5 | 55·7 | 59·1 | 64·0 | 52·4 |
(a) Jessica notes that, for the thigh girth data, the lower quartile is 49·5 and the upper quartile is 64·0.
(i) Show that 87·2 should be classified as an outlier for \(t\).
(ii) Give a reason why Jessica might exclude the outlier.
(iii) Give a reason why Jessica might include the outlier. [4]
Jessica decides to exclude the outlier and produces the following scatter diagram.
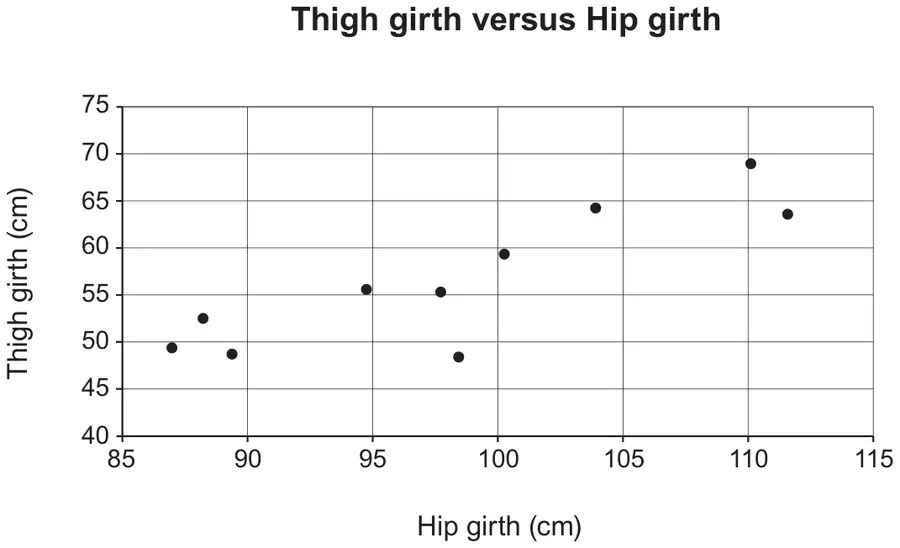
(b) Interpret, in context, the correlation in the data shown in the diagram. [1]
The equation of the regression line of \(t\) on \(h\) for this sample is
\[t=0{\cdot}69h-11{\cdot}26.\]
(c) Interpret the gradient of the regression line in this context. [1]
(d) Use your knowledge of large data sets and spreadsheet software packages to suggest a way in which Jessica could improve her investigation. [1]
| Scheme | Marks | Comments |
|---|---|---|
| (i) \(64+(64-49.5)\times1.5\) \((=64+14.5\times1.5=85.75)\) | M1 | Use of rule \(Q_3+1.5\text{IQR}\) |
| \(87.2>85.75\) therefore, it’s an outlier. | A1 | Correct calculation and conclusion. |
| (ii) Valid reason. e.g. May distort calculations and therefore inferences about population. | E1 | Condone “so that the mean will not be affected by outliers.” Allow “there may have been an error in measurement”. Allow “may skew the data”. E0 for “median does not change”. E0 for “make calculations more reliable”. |
| (iii) Valid reason. e.g., It’s only just an outlier. Still a valid measurement so should include it. | E1 | Condone “to use all of the data”. |
| Scheme | Marks | Comments |
|---|---|---|
| The larger the hip girth, the larger the thigh girth, on average. | E1 | oe Condone ‘tends’ or ‘in general’ in place of on average. Penalise first omission of on average only. |
| Scheme | Marks | Comments |
|---|---|---|
| Each increase of 1 cm of hip girth corresponds to a 0.69 cm increase in thigh girth on average. | E1 | Penalise first omission of on average only. Watch out for hip girth and thigh girth in the wrong order. |
| Scheme | Marks | Comments |
|---|---|---|
| Using all of the data instead of a sample would lead to more accurate results. | E1 | Condone increase sample size provided no nonsensical statements follow. Do not allow reference to other sampling methods. |
| Total [7] |