
June 2022 Unit 4 Q5
5. A government statistician wishes to investigate whether there is positive correlation between the variables Average score in the National Reading Test and Average House Price. She collects data on a randomly selected sample of 21 areas within Wales.
(a) Carry out a 5% significance test for correlation between the two variables, using the computer output below. [5]
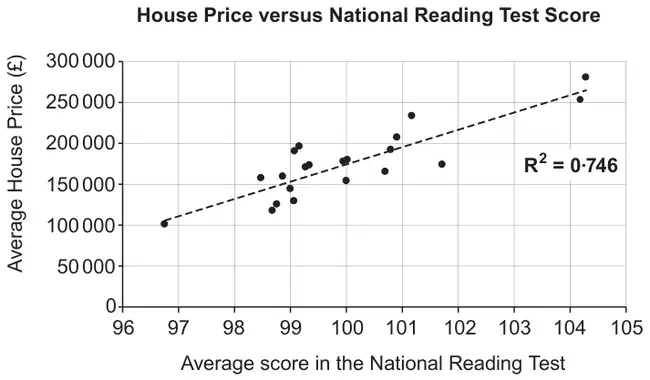
After seeing this output, the editor of a newspaper leads with the front-page headline,
“Buy a more expensive house to boost your children’s reading ability!”
(b) Discuss whether the data support the headline. [2]
(c) Give a possible alternative explanation for this correlation. [1]
| Scheme | Marks | Comments |
|---|---|---|
| (Let \(\rho\) denote the population correlation coefficient between average house price and average score in the national reading test). \(H_0:\rho=0\) \(H_1:\rho\gt 0\) | B1 | Allow other letters if defined. Allow worded hypotheses. B0 for \(H_0\): correlation = 0. Population must be stated or implied. B0 for omission of \(\rho\) or use of \(r\) B0 for a non-strict inequality in \(H_1\) |
| TS = 0.86371… | B1 | Labelled as TS or used in comparison B0 for \(TS=\pm 0.86371\) unless the positive value correctly used later. |
| CV = 0.3687 | B1 | FT their hypotheses (e.g., 0.4329 for two-tailed) |
| Since TS > 0.3687, there is sufficient evidence to reject \(H_0\). | B1 | FT for using 0.746 FT their CV |
| Sufficient evidence to suggest there is positive correlation between the average house price and average national reading test score. | E1 | CSO (correct solution only). E0 for categorical statements or omission of the word positive (unless positive implied by contextualised comment). E0 for conclusion not in context |
Part (a) Total | [5] |
| Scheme | Marks | Comments |
|---|---|---|
| Valid comment saying the two variables are linked, i.e., giving a reason for the headline. e.g., The data support the idea that the more expensive houses are correlated with better reading scores. | E1 | |
| Valid comment saying why the headline is unreasonable. e.g., It’s unreasonable to suggest that a more expensive house will improve a child’s reading ability. | E1 | E0 for correlation does not imply causation unless explained in context. Condone responses that give a valid alternative explanation for the correlation. |
Part (b) Total | [2] |
| Scheme | Marks | Comments |
|---|---|---|
| Possible explanation. e.g., parents who can afford better houses may have a better education so are more likely to help their children to read. | E1 | E0 for comments such as “those with higher reading scores can afford better houses”. Do not accept “small sample size” or “it is a coincidence”. Condone a repetition of a valid alternative explanation that was given in (b). Do not condone a valid alternative explanation given in (b) only. |
Part (c) Total | [1] | |
| Total for Question 5 | 8 |