
June 2019 Unit 2 Q5
5. Huw investigates the opinion of the public about their local primary schools. He visits his town centre and administers a questionnaire to 120 people over the course of several days.
(a) What type of sampling is this? [1]
(b) How could Huw’s sampling be improved? [1]
Huw wishes to investigate the relationship between the population and the number of primary schools in a county. He searches the internet for data and selects a random sample of 24 counties from the UK. He produces the following scatter diagram.
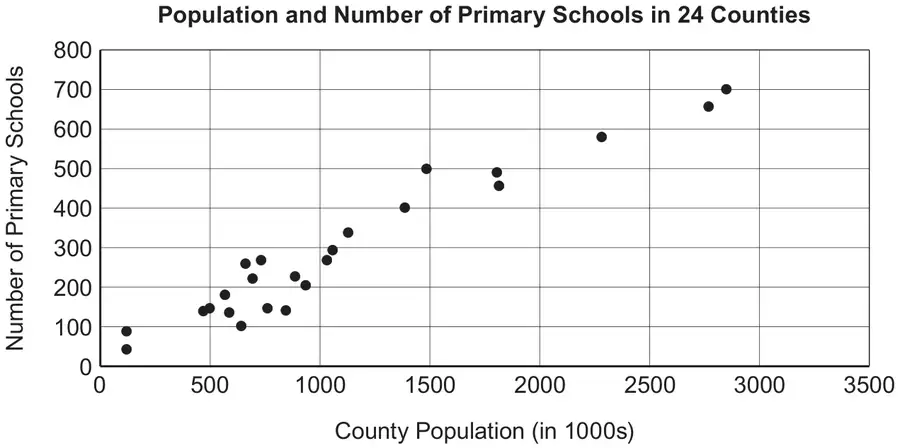
The equation of the regression line for this dataset is given by
\[\text{Number of Primary Schools}=22{\cdot}7+0{\cdot}2406\times\text{County Population (in 1000s)}.\]
(c) State a limitation of this regression line. [1]
(d) Calculate an estimate for the number of primary schools in a county with a population of 889 000. [2]
(e) Statisticians often say, “Correlation does not imply causation”. Comment on this statement in this context. [1]
| Scheme | Marks | Comments |
|---|---|---|
| Opportunity sampling. | B1 |
| Scheme | Marks | Comments |
|---|---|---|
| Valid comment. eg. Go to different areas, as this is a biased sample. Many of his responders will be from the same community. | B1 |
| Scheme | Marks | Comments |
|---|---|---|
| Appropriate statement. eg. The line is only valid for predicting the number of primary schools in counties with populations between approximately 100,000 and 2,800,000. | E1 | Allow: The model predicts that a county with a population of 0 has about 23 primary schools |
| Scheme | Marks | Comments |
|---|---|---|
| \(\text{No. of Primary Schools}=22.7+0.2406\times889\) | M1 | M0 for using 889,000 |
| \(=237\text{ schools}\) | A1 | A0 for 236.5934 |
| Scheme | Marks | Comments |
|---|---|---|
| Appropriate comment. eg. It is likely that number of primary schools IS caused by a greater population (because local authorities are obliged to provide education). Closing a school doesn’t automatically decrease the county population (as pupils would be absorbed into other local schools) Increasing the county population doesn’t automatically increase the number of schools, (but they are clearly related) | E1 | Do not accept a categorical statement of causation |
| [6] |