
May 2023 Paper 1 Q9
9. The diagram shows the graph of the function \(f(x)=\log_3x\), where \(x>0\).
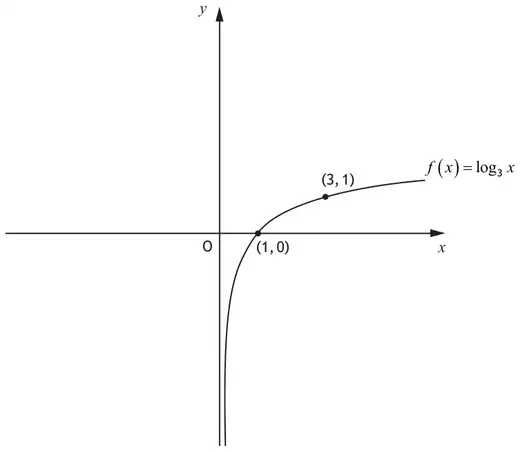
The inverse function, \(f^{-1}\), exists.
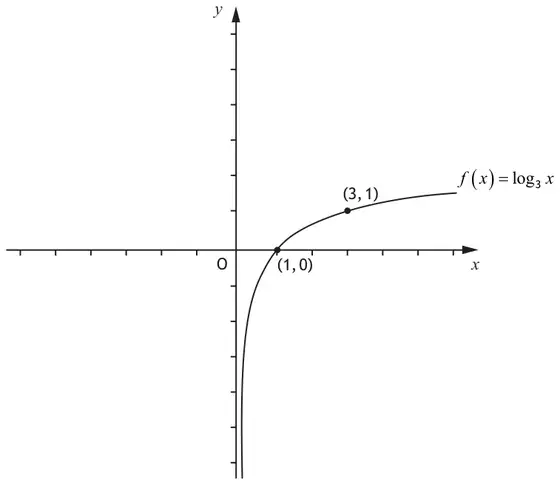
On the diagram in your answer booklet (shown below), sketch the graph of \(y=f^{-1}(x)-1\). [3]
| Mark | Generic scheme | Illustrative scheme |
|---|---|---|
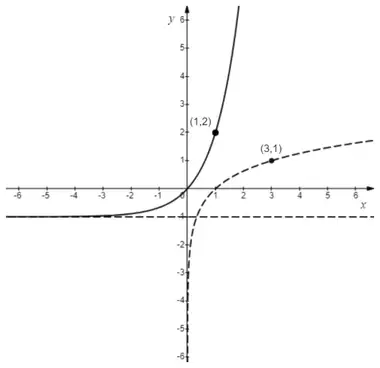
| •1 | graph reflected in \(y=x\) | a concave up curve above the \(x\)-axis for \(x>0\) |
| •2 | vertical translation of “\(-1\)” unit following a reflection in \(y=x\) identifiable from graph | curve passing through (0,0) and (1,2) |
| •3 | sketch of required function | curve approaches the line \(y=-1\) from above as \(x\to-\infty\)
|
| (3) |
Notes:
- For •1 accept any graph of a function which is concave up within the first quadrant.
- •1 is only available where the candidate has attempted to reflect the given curve in the line \(y=x\).
- •3 is only available where the curve passes through (0,0) and (1,2).
- The line \(y=-1\) does not need to be shown.
- For a rotation, award 0/3 – for example see Candidate D.
Commonly Observed Responses:
Candidate A - reflection only
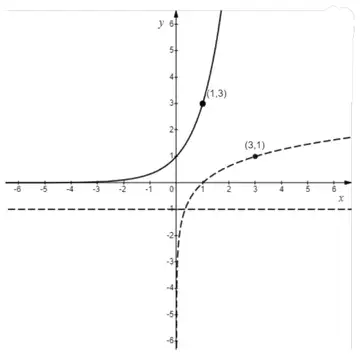
•1 ✓ •2 ✗ •3 ✗
Candidate B - translation only
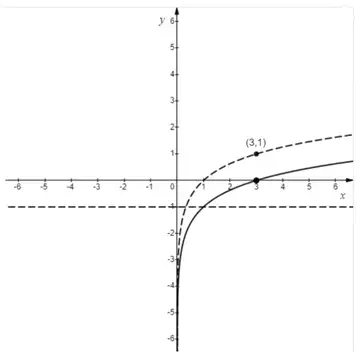
•1 ✗ •2 ✗ •3 ✗
Candidate C - incorrect order of transformations
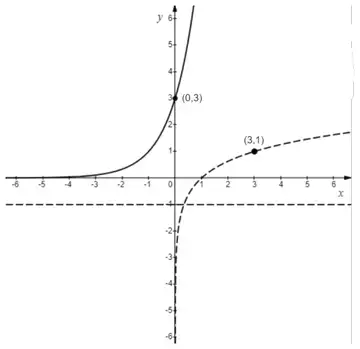
•2 ✗ •1 ✓1 •3 ✗
Candidate D - rotation
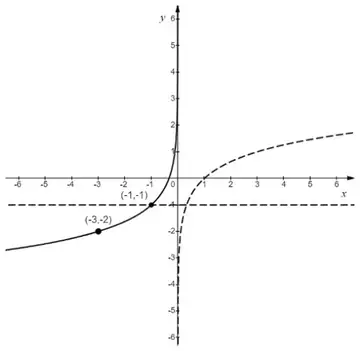
•1 ✗ •2 ✗ •3 ✗