
Foundation November 2022 Paper 1 Q15
15 A researcher asked 53 customers leaving a fish and chip shop what they had bought.
The Venn diagram shows some of the results.
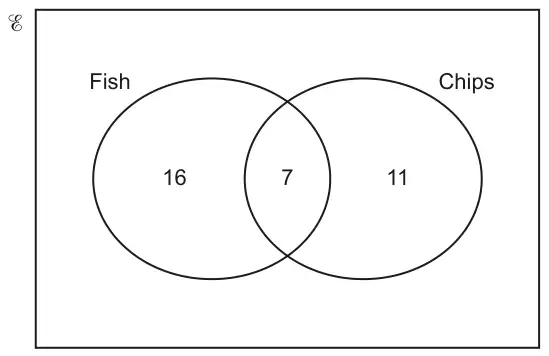
(a) How many customers bought chips but not fish? [1]
(b) Complete the Venn diagram to show the number of customers who did not buy fish or chips. [2]
(c) One of the 53 customers is chosen at random.
Write down the probability that this customer bought fish. [2]
| Answer | Marks | Part marks and guidance | |
|---|---|---|---|
| 11 | 1 | ||
| Answer | Marks | Part marks and guidance | |
|---|---|---|---|
| 19 in correct position | 2 | M1 for \(53 - (16 + 7 + 11)\) may be implied by 19 in working space | For 2 marks only 19 added to diagram |
| Answer | Marks | Part marks and guidance | |
|---|---|---|---|
| \(\dfrac{23}{53}\) or 0.43, 0.434 or 43%, 43.4% | 2 | M1 for \(16 + 7\) implied by 23 | 23 must clearly be their final total Isw incorrect cancelling of correct fraction but do not allow conversion to incorrect form e.g 23 out of 53 or 23 : 53 for 2 marks |