
October 2021 Paper 1 Q11
11 A student is investigating changes in the number of residents in Local Authorities in the South-East Region between 2001 and 2011. The scatter diagram shows the number \(x\) of residents in these Local Authorities in the age group 8 to 9 in 2001 and the number \(y\) of residents in the same Local Authorities in the age group 18 to 19 in 2011.
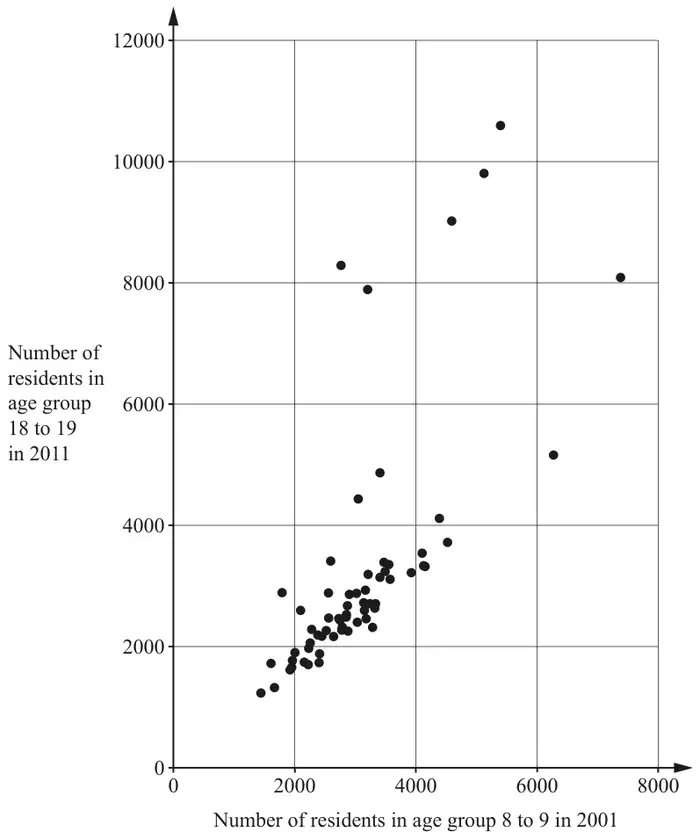
The student notices that most of the data points are close to the line \(y = x\).
Explain whether or not they are correct. [1]
Assume that the proportion of residents in age group 8 to 9 in 2001 was roughly the same in each Local Authority in the South-East. The Local Authority in this region with the largest population is Medway.
| Scheme | Marks |
|---|---|
| Those in age group 8 to 9 in 2001 will be in age group 18 to 19 in 2011 | B1 |
| [1] |
Notes
B1: or, eg, "Same people" May be implied
| Scheme | Marks |
|---|---|
| (i) Few people joined (or left) this group oe or "Not much change in this group" or “Most have lived there since 2001” | B1 |
| [1] | |
| (ii) (No) The nos of 18-19's in 2011 is (largely) caused by the nos of 8-9s in 2001, (but this cannot be inferred from the correlation). | B1 |
| [1] |
Notes
(i): LAs with a high number of 8-9s in 2001 have a high number of 18-19s in 2011
Most have stayed in the same area since childhood
(ii): (No) There is a link. They are the same people
Must state or imply that there is a link between \(x\) and \(y\) in this context.
| Scheme | Marks |
|---|---|
| (i) 3 (or 4 or 5) of the highest five \(y\)-values | B1 |
| [1] | |
| (ii) In these LAs, the no. of 18-19s in 2011 is more than the no. of 8-9s in 2001 In these LAs there are large numbers of 18+ | B1 |
| [1] |
Notes
(i): Must not include right-most point
(ii): eg, the no. of people in this group in 2011 is more than it was in 2001
Students are aged 18+ so they cause an increase in this age group
Allow numerical example. May be implied
Not just “These are outliers” oe
| Scheme | Marks |
|---|---|
| Right most point indicated | B1 |
| [1] |