
June 2022 Paper 1 Q8
8 A random sample of 10 students from a college was chosen. They were asked how much time, \(x\) hours, they spent studying, and how much money, £\(y\), they earned, in a typical week during term time. The results are shown in the scatter diagram.
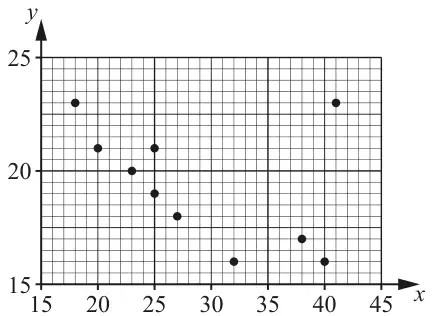
(a) Comment on the relationship shown by the diagram between hours spent studying and money earned, during term time, by these 10 students. [2]
The coordinates of the points in the diagram are (18, 23), (20, 21), (23,20), (25, 19), (25, 21), (27,18), (32, 16), (38, 17), (40, 16) and (41, 23).
(b) Find the mean and standard deviation of the number of hours spent per week studying during term time by these 10 students. [2]
| Scheme | Marks | AO |
|---|---|---|
| Basic scheme: B1 for negative correlation in context soi B1 for any indication of caution about conclusion | ||
| Negative correlation between hours and money stated or implied, eg by such as: Time spent on earning reduces time on school work | B1 | 1.2 |
| Except for one student (or one point) or There is an outlier or anomaly oe or Small sample so unreliable | B1 | 2.2b |
| [2] |
Notes
B1: Must be in context
B1: Allow without context
Or Poor (or no) correlation between hours and money B1 because of the outlier B1
| Scheme | Marks | AO |
|---|---|---|
| Mean \(= 28.9\) | B1 | 3.1a |
| SD \(= 7.93\) (3 sf) | B1 | 1.1 |
| [2] |
Notes
B1: Allow 28.8
B1: cao Ignore all else