
June 2019 Paper 2 Q4
4 A species of animal is to be introduced onto a remote island. Their food will consist only of various plants that grow on the island. A zoologist proposes two possible models for estimating the population \(P\) after \(t\) years. The diagrams show these models as they apply to the first 20 years.
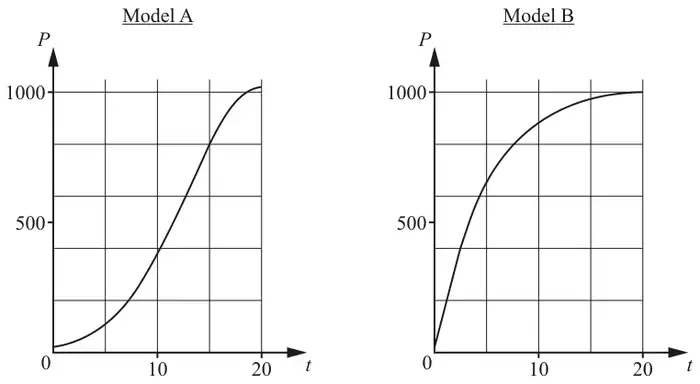
The equation of the curve for model A is \(P = 20 + 1000\mathrm{e}^{-\frac{(t - 20)^2}{100}}\).
The equation of the curve for model B is \(P = 20 + 1000\left(1 - \mathrm{e}^{-\frac{t}{5}}\right)\).
There is only a limited amount of food available on the island, and the zoologist assumes that the size of the population depends on the amount of food available and on no other external factors.
| Scheme | Marks | AO |
|---|---|---|
| A: Growth (rate) increases, then decreases Grows slowly, then quickly, then slowly B: Growth (rate) decreases Grows quickly then slowly Both | B1 | 2.2b |
| [1] |
Notes
In all parts ignore nos except 20, & 1020
BOD if describe growth rather than rate in (a) and (b)
Condone muddle between \(P\) and growth of \(P\) in (a) and (b)
B1: A: Allow increase, constant, then decrease or "levels off", "tails off", "plateaus"
B: Allow "levels off", "tails off", "plateaus"
NOT "\(P\)" decreases, for A or B
Ignore "exponentially"
| Scheme | Marks | AO |
|---|---|---|
| (i) A: \(P\) (decreases and) tends to 20 or (Decreases and) doesn't go below 20 | B1 | 3.4 |
| [1] | ||
| (ii) B: \(P\) tends to 1020 oe \(P\) doesn't exceed 1020 | B1 | 3.4 |
| [1] |
Notes
In all parts ignore nos except 20, & 1020
BOD if describe growth rather than rate in (a) and (b)
Condone muddle between \(P\) and growth of \(P\) in (a) and (b)
(b)(i) B1: Allow (Decrease and) reach 20,
Must mention 20 (as population, not years)
Ignore all else
(b)(ii) B1: Growth is asymptotic around 1020
Settles at 1020. Saturates at 1020
Converges to 1020. Allow reaches 1020
Plateaus at 1020. Asymptote at 1020
Must mention 1020
NOT: Pop increases, but slowly
Diverges to 1020
Tends to 1020, then down
Ignore all else
| Scheme | Marks | AO |
|---|---|---|
| (i) A: Food (almost) runs out, or is used up oe or becomes very low or there will be a shortage oe or begins to run out | B1 | 3.5a |
| [1] | ||
| (ii) B: Food sufficient to support a pop \(\approx 1020\) Enough to sustain equilibrium (or population) Barely enough, can't support increase in P Food limited so pop can't continue to grow | B1 | 3.5a |
| [1] |
Notes
In all parts ignore nos except 20, & 1020
(c)(i) B1: or will only support a population of 20
Won't sustain large nos.
Insufficient
NB "Limited" allowed in c(ii), not c(i)
NOT: just Limited, Finite
NOT: just "Decreases"
Ignore all else
(c)(ii) B1: Stays stable
Sustainable
Constant
Must imply at least two of:
1. Food won't run out and
2. Food limited or equilibrium
3. Can't support increase in \(P\)
Ignore all else